Venn Diagrams
3 previous year questions.
High-Yield Trend
Chapter Questions 3 MCQs
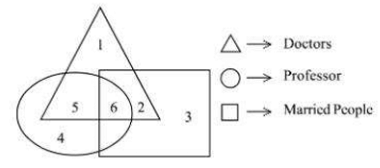
In figure out which Number indicate doctors who are not married
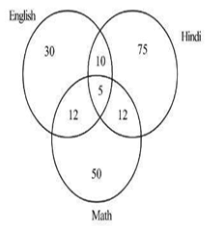
Consider the Diagram. 500 Candidates appeared in an Examination comprising test in English, Hindi and Maths. The Diagram gives number of students who failed in different tests. What is the percentage of student who failed at least two subjects?


About Venn Diagrams - CUET-UG
Venn Diagrams is a vital chapter for CUET-UG aspirants. Mastering the concepts covered in this chapter is essential for securing a top rank.
By rigorously practicing the previous year questions associated with this chapter, you can identify high-yield topics, understand the examiner's perspective, and boost your confidence during the actual exam.
Frequently Asked Questions
Why focus on Venn Diagrams PYQs?
Analyzing PYQs for this specific chapter reveals the most frequently tested concepts and the typical complexity of questions, allowing you to tailor your study plan efficiently.
How to best use this analysis?
Review the topic breakdown to see which sub-topics within Venn Diagrams carry the most weight. Then, tackle the questions iteratively to solidify your understanding.