Microeconomics
49 previous year questions.
High-Yield Trend
Chapter Questions 49 MCQs
Official Solution
Excess Demand, also known as an inflationary gap, refers to a macroeconomic situation where the aggregate demand (AD) for goods and services in an economy is greater than the aggregate supply (AS) at the full employment level of output. In this situation, the economy is trying to spend more than it is capable of producing, as all resources are already fully employed. This excess pressure on demand leads to a persistent rise in the general price level, causing inflation.
The diagram below shows the AS curve (45-degree line) and two AD curves. ADF represents the aggregate demand required for full employment equilibrium at point E. ADE represents the actual (excess) aggregate demand. The vertical distance between ADE and ADF (gap EF) is the inflationary gap.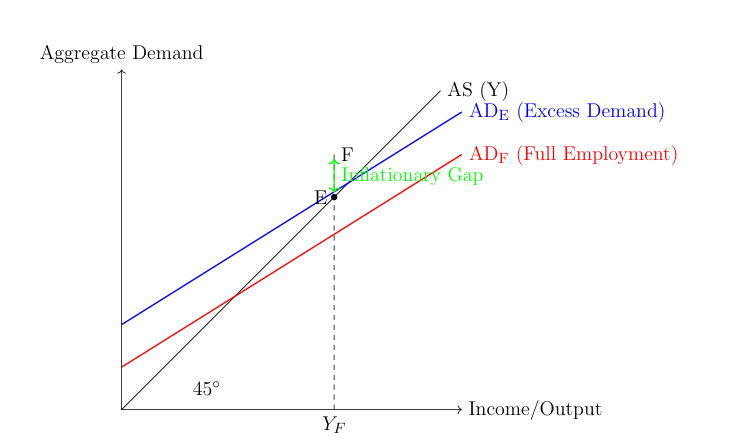
Important Causes of Excess Demand
Important Causes of Excess Demand:
Excess demand arises due to an increase in any of the components of aggregate demand (AD = C + I + G + (X-M)). The main causes are:
- Increase in Consumption Expenditure (C): This can be due to:
- A rise in the marginal propensity to consume (MPC) or a fall in the marginal propensity to save (MPS).
- Increased availability of credit and lower interest rates, encouraging borrowing and spending.
- Increase in Private Investment Expenditure (I):
- Optimistic business expectations about future profits.
- Lower interest rates, which make borrowing for investment cheaper.
- Increase in Government Expenditure (G):
- A rise in government spending on infrastructure, defense, or social welfare programs without a corresponding increase in taxes.
- Increase in Net Exports (X-M):
- A rise in exports due to higher demand from other countries or a fall in the exchange rate.
- A fall in imports due to factors like higher tariffs.
- Increase in Money Supply: An expansionary monetary policy (often called "printing money" or quantitative easing) increases the purchasing power in the economy, leading to higher aggregate demand.
- Decrease in Taxes: Lower direct or indirect taxes leave households and firms with more disposable income, which can lead to higher consumption and investment.
Official Solution
In a perfectly competitive market, the price of a commodity is determined by the collective forces of market demand and market supply. No individual firm or buyer can influence the price; they are "price takers." The price is set at the equilibrium point where the total quantity demanded by all consumers equals the total quantity supplied by all producers in the industry.
Determination of Equilibrium Price:
- Market Demand: It is the sum of the quantities demanded by all buyers at different prices. The market demand curve is downward sloping, indicating that consumers will buy more at a lower price.
- Market Supply: It is the sum of the quantities supplied by all firms at different prices. The market supply curve is upward sloping, indicating that producers will sell more at a higher price.
The equilibrium price is established where the market demand curve intersects the market supply curve. At this point, there is neither a shortage nor a surplus of the commodity in the market.
Example with a Schedule:
Let’s consider a hypothetical market for wheat. The following schedule shows the quantity demanded and supplied at various prices.
Price per kg ( 5, suppliers are willing to sell 5,000 kg, but consumers only want to buy 1,000 kg. This surplus of 4,000 kg will force producers to lower their prices to sell their stock.Explanation with a Diagram:
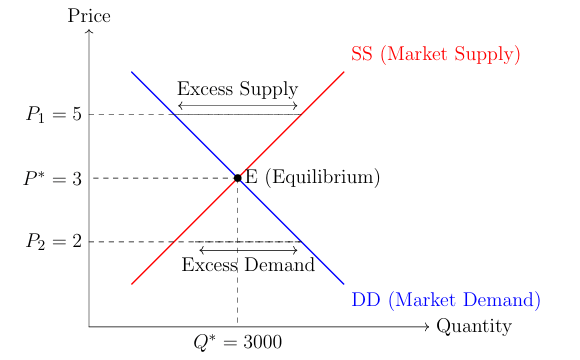 In the diagram, the market demand curve (DD) and market supply curve (SS) intersect at point E. This is the equilibrium point. The price corresponding to this point is P∗, and the quantity is Q∗. At any price above P∗ (like P1), there is excess supply, which pushes the price down. At any price below P∗ (like P2), there is excess demand, which pushes the price up. Thus, the market naturally gravitates towards the equilibrium price P∗ 03
PYQ 2023 medium economics ID: up-board Calculate marginal production and average production from the following data: 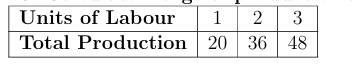 Official SolutionCorrect Option:
(1) The calculations for Marginal Production (MP) and Average Production (AP) are as follows: Formulas:Average Production (AP) = Total Production / Units of Labour Marginal Production (MP) = Change in Total Production / Change in Units of Labour Calculations:For 1 unit of Labour:AP = MP = For 2 units of Labour:AP = MP = For 3 units of Labour:AP = MP = Result Table:
04
PYQ 2023 medium economics ID: up-board What is perfect competition? Highlight its salient features. Official SolutionCorrect Option:
(1) Perfect competition is a market structure where a large number of buyers and sellers trade a homogeneous (identical) product, and no single buyer or seller can influence the market price. Firms in this market are "price takers." Salient Features of Perfect Competition: Large Number of Buyers and Sellers: The market consists of so many participants that no single individual has any control over the price. Homogeneous Product: All firms sell an identical product. From the consumer's perspective, the product of one firm is a perfect substitute for the product of another. Freedom of Entry and Exit: Firms can freely enter the industry to earn profits and exit if they are incurring losses. There are no barriers to entry or exit. Perfect Knowledge: Both buyers and sellers have complete information about the market conditions, including prices and quality of the product. Perfect Mobility of Factors of Production: Resources like labor and capital can move freely from one firm to another or from one industry to another. No Selling Costs: Since the products are homogeneous, there is no need for advertising or other sales promotion activities. 05
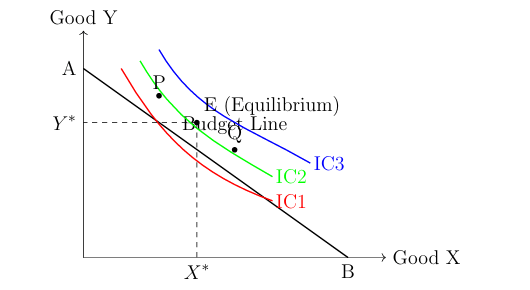
PYQ 2023 medium economics ID: up-board What do you understand by Indifference curve ? Explain Consumer's Equilibrium with the help of Indifference curves. Official SolutionCorrect Option:
(1) An indifference curve is a graphical representation of various combinations of two goods that provide a consumer with the same level of satisfaction or utility. The consumer is therefore "indifferent" to any combination of goods on the same curve. Properties of Indifference Curves:Downward Sloping: To consume more of one good, the consumer must give up some quantity of the other good to maintain the same level of satisfaction. Convex to the Origin: This reflects the diminishing Marginal Rate of Substitution (MRS). MRS is the rate at which a consumer is willing to substitute one good for another. As a consumer has more of a good, they are willing to give up less of the other good to get an additional unit of it. Higher Indifference Curve represents Higher Satisfaction: Any combination on a higher IC is preferred to any combination on a lower IC. Indifference Curves Never Intersect: If they did, it would imply a logical contradiction in consumer preferences. Consumer's Equilibrium:Consumer's equilibrium refers to a situation where a consumer spends their given income on the purchase of goods in such a way that maximizes their total satisfaction, with no tendency to change. Conditions for Consumer's Equilibrium:The budget line should be tangent to the indifference curve: At the point of tangency, the slope of the indifference curve (Marginal Rate of Substitution, MRS) is equal to the slope of the budget line (price ratio of the two goods). The indifference curve must be convex to the origin at the point of equilibrium: This ensures that the MRS is diminishing, which is a necessary condition for a stable equilibrium. Explanation with a Diagram:In the diagram below, AB is the budget line, which shows the different combinations of Good X and Good Y that the consumer can afford with their given income. IC1, IC2, and IC3 are indifference curves representing different levels of satisfaction.
The consumer can afford points P and Q, but they lie on a lower indifference curve (IC1), providing less satisfaction. Any point on IC3 is desirable but is beyond the consumer's budget line. Point E is the equilibrium point where the budget line AB is tangent to the highest attainable indifference curve, IC2. At point E, the consumer buys X units of Good X and Y units of Good Y, achieving maximum satisfaction 06
PYQ 2023 medium economics ID: up-board What is Elasticity of Demand ? Explain percentage method of its measurement. Official SolutionCorrect Option:
(1) Price elasticity of demand is a measure of the degree of responsiveness of the quantity demanded of a good to a change in its own price. It quantifies how much the quantity demanded changes when the price changes. It is calculated as the percentage change in quantity demanded divided by the percentage change in price. In simple terms, it tells us how sensitive consumers are to a price change. If a small change in price causes a large change in quantity demanded, demand is elastic ( ). If a large change in price causes a small change in quantity demanded, demand is inelastic ( ). If a change in price causes a proportional change in quantity demanded, demand is unitary elastic ( ). Percentage Method of Measurement:The percentage method is the most common way to calculate price elasticity of demand. It measures elasticity by dividing the percentage change in quantity demanded by the percentage change in price. The formula is: This can be expressed as: Where:
The value of is usually negative due to the inverse relationship between price and quantity demanded, but we often consider its absolute value for interpretation. Numerical Example:Suppose the price of a coffee cup increases from \$4 to \$5. As a result, the quantity demanded per day falls from 200 cups to 150 cups. Original Price (P) = \$4 New Price ( ) = \$5 Original Quantity (Q) = 200 cups New Quantity ( ) = 150 cups Step 1: Calculate the changes in price and quantity.Step 2: Calculate the percentage changes.Step 3: Calculate Elasticity.Conclusion:Since the absolute value of elasticity is 1, the demand for coffee in this price range is unitary elastic. A 25% increase in price led to exactly a 25% decrease in quantity demanded. 07
PYQ 2023 medium economics ID: up-board What is Micro-economics? Official SolutionCorrect Option:
(1) Microeconomics is the branch of economics that studies the behavior and decision-making of individual economic agents, such as households, firms, and individuals. It focuses on how these agents allocate scarce resources and how their choices interact in specific markets for goods and services. 08
PYQ 2023 medium economics ID: up-board What do you understand by 'Demand' ? Official SolutionCorrect Option:
(1) In economics, demand refers to the quantity of a good or service that consumers are willing and able to purchase at various prices during a specific period. It is not just the desire for a product but must be backed by the purchasing power and willingness to pay. 09
PYQ 2023 medium economics ID: up-board What are complementary goods? Official SolutionCorrect Option:
(1) Complementary goods are products that are consumed together. The demand for one good is directly related to the demand for the other; if the price of one good decreases, the demand for its complement increases. Common examples include cars and gasoline, printers and ink cartridges, and coffee and sugar. 10
PYQ 2023 medium economics ID: up-board What is production function ? Official SolutionCorrect Option:
(1) A production function is a technical relationship that shows the maximum quantity of output that can be produced from a given set of inputs (like labor, capital, and land). It is represented by the equation , where Q is the output, L is labor, and K is capital. 11
PYQ 2023 medium economics ID: up-board Explain important factors affecting demand. Official SolutionCorrect Option:
(1) The important factors that affect the demand for a commodity are: 1. Price of the Good: According to the law of demand, there is an inverse relationship between the price of a good and the quantity demanded, ceteris paribus. 2. Income of the Consumer: For normal goods, demand increases as income rises. For inferior goods, demand decreases as income rises. 3. Prices of Related Goods: Substitute Goods: An increase in the price of a substitute (e.g., tea) leads to an increase in the demand for the good (e.g., coffee). Complementary Goods: An increase in the price of a complement (e.g., gasoline) leads to a decrease in the demand for the good (e.g., cars). 4. Tastes and Preferences: A favorable change in consumer tastes or preferences for a product will increase its demand. 5. Consumer Expectations: Expectations of a future rise in price may lead to an increase in current demand. 6. Number of Buyers: An increase in the number of consumers in the market increases the market demand for the good. 12
PYQ 2023 medium economics ID: up-board Which of the following indicates fixed cost? 1 Electricity bill 2 Expenses on raw material 3 Wages 4 Interest on fixed capital Official SolutionCorrect Option:
(4)
Step 1: Understanding the Concept: In business and economics, costs are divided into two main categories: fixed costs and variable costs. Fixed Costs are expenses that do not change with the level of production or sales. They have to be paid even if the company produces nothing. Examples include rent, salaries of administrative staff, insurance, and interest payments on loans. Variable Costs are expenses that change in direct proportion to the level of production. Examples include raw materials, direct labor wages, and electricity used for production. Step 2: Detailed Explanation: Let's analyze the options: (A) Electricity bill: This is typically a variable cost (or semi-variable) because more production usually requires more electricity. (B) Expenses on raw material: This is a classic variable cost. The more you produce, the more raw materials you need. (C) Wages: This can be either fixed (e.g., monthly salaries for managers) or variable (e.g., hourly wages for production workers). However, it is not always a purely fixed cost. (D) Interest on fixed capital: Fixed capital refers to assets like machinery and buildings. The interest on loans taken to purchase this capital is a fixed payment that must be made regardless of production levels. This makes it a clear example of a fixed cost. Step 3: Final Answer: Among the given options, interest on fixed capital is the clearest and most definitive example of a fixed cost. The correct option is (D). 13
PYQ 2023 medium economics ID: up-board In the case of normal goods, demand curve shows 1 positive slope 2 negative slope 3 zero slope 4 none of these. Official SolutionCorrect Option:
(2)
Step 1: Understanding the Concept: The law of demand describes the relationship between the price of a good and the quantity demanded by consumers. For normal goods, this relationship is inverse: as the price of a good increases, the quantity demanded decreases, and vice versa, assuming all other factors remain constant (ceteris paribus). Step 2: Detailed Explanation: A demand curve is a graphical representation of this relationship, with price plotted on the vertical (Y) axis and quantity demanded on the horizontal (X) axis. - An increase in price (a move up the Y-axis) leads to a decrease in quantity demanded (a move to the left on the X-axis). - A decrease in price (a move down the Y-axis) leads to an increase in quantity demanded (a move to the right on the X-axis). When you connect these points on a graph, the resulting line slopes downwards from left to right. A downward-sloping line has a negative slope. Step 3: Final Answer: Therefore, the demand curve for normal goods shows a negative slope, reflecting the inverse relationship between price and quantity demanded. The correct option is (B). 14
PYQ 2023 medium economics ID: up-board Who propounded indifference curve analysis ? 1 Marshall 2 Pigou 3 Hicks 4 Robbins Official SolutionCorrect Option:
(3)
Step 1: Understanding the Concept: Indifference curve analysis is a tool in microeconomics used to study consumer behavior. It shows various combinations of two goods that provide a consumer with an equal level of satisfaction or utility. Step 2: Detailed Explanation: The concept of indifference curves was originally developed by Francis Ysidro Edgeworth in 1881 and later refined by Vilfredo Pareto in 1906. However, the modern, comprehensive form of indifference curve analysis was propounded and popularized by Sir John R. Hicks and R.G.D. Allen in the 1930s. Among the given options, Hicks is the correct choice as he was a key figure in developing this theory into its current form. - Alfred Marshall is known for the cardinal utility approach. - A.C. Pigou is known for his work in welfare economics. - Lionel Robbins is known for his definition of economics based on scarcity. Step 3: Final Answer: Given the options, J.R. Hicks is the economist credited with propounding the modern indifference curve analysis. Thus, option (C) is correct. 15
PYQ 2024 medium economics ID: up-board When the price of a commodity declines from Rs. 15 per unit to Rs. 10 per unit, its demand increases from 40 units to 50 units. Calculate elasticity of demand. Official SolutionCorrect Option:
(1) Use the arc (mid-point) elasticity formula to avoid base dependence: Step 1: , average quantity \Rightarrow . Step 2: , average price \Rightarrow . Step 3: ; demand elasticity in absolute value . 16
PYQ 2024 medium economics ID: up-board What do you mean by Perfect Competition? Discuss its salient features. Official SolutionCorrect Option:
(1)
Meaning: Perfect competition is a market structure in which numerous small buyers and sellers trade a homogeneous product under conditions of perfect knowledge and free entry and exit, so that no individual participant can influence price. Firms are price takers. Features: (1) Large number of buyers and sellers: Each is too small relative to the market to affect price by individual action. (2) Homogeneous product: Buyers regard output units as identical; no brand or quality differentiation. (3) Free entry and exit: In the long run, firms can enter/leave without barriers, driving economic profit to zero. (4) Perfect information: Buyers and sellers know prices, technology, and costs; arbitrage eliminates price differences. (5) Perfect mobility of factors: Resources can move across firms/industries; no artificial restrictions. (6) No selling costs: Advertising is unnecessary because products are identical. (7) Single, uniform price: Determined by market demand and supply. Firm's demand and equilibrium: A firm faces a perfectly elastic (horizontal) demand at the market price: . Profit maximization occurs where ; in the short run the firm may earn supernormal profits or losses; in the long run, entry/exit ensures (productive efficiency) and (allocative efficiency). Implications: Perfect competition yields the benchmark of maximum total surplus with no deadweight loss under standard assumptions. Limitations: Real markets rarely meet all conditions; however, agricultural commodities, foreign exchange, or stock exchange trading approximate some features. 17
PYQ 2024 medium economics ID: up-board Explain Fixed cost, Variable cost and Total cost. Official SolutionCorrect Option:
(1)
Fixed Cost (TFC): Costs that do not vary with output in the short run—rent of factory, insurance, salaries of permanent staff, depreciation. Even when output is zero, TFC is incurred; hence TFC is a horizontal line with respect to output. Variable Cost (TVC): Costs that change directly with output—wages of casual labour, raw materials, power, packaging. TVC is zero at zero output and typically rises at a decreasing then increasing rate due to returns to the variable factor. Total Cost (TC): Sum of fixed and variable costs: . Average and marginal counterparts are (always falling), , , and . In the short run, , , and are typically U-shaped, with cutting and at their minimum points. 18
PYQ 2024 medium economics ID: up-board What do you mean by Revenue? Official SolutionCorrect Option:
(1)
Measures: Total Revenue (TR) . Average Revenue (AR) ; in single-price markets, AR equals price. Marginal Revenue (MR) , the extra revenue from an additional unit. Market structure link: Under perfect competition, is constant, so AR MR P and the TR curve is a straight line. Under monopoly/monopolistic competition, price must fall to sell more, so MR lies below AR and both slope downward. Decision use: Profit-maximizing output occurs where , not where TR is highest. 19
PYQ 2024 medium economics ID: up-board What is meant by the word 'Market'? Official SolutionCorrect Option:
(1)
Modern view: A market is a system of interactions—institutions, rules, and communication channels—linking potential buyers and sellers. It may be local, national, or global and can be physical (bazaar) or virtual (e-commerce, stock exchanges). Core elements: (i) a commodity/service, (ii) parties willing to trade, (iii) a mechanism for information and payment, and (iv) rules enabling contracts. Economic role: Markets allocate resources by signaling scarcity through prices; competitive markets foster efficiency, while market failures (externalities, market power, information asymmetry) may justify policy intervention. 20
PYQ 2024 medium economics ID: up-board What is meant by Average Production? Official SolutionCorrect Option:
(1)
Definitions: Total Product (TP) is the total output produced; Marginal Product (MP) is the additional output from one more unit of input; Average Product (AP) is per unit of the input. Relationships: When MP exceeds AP, AP rises; when MP is below AP, AP falls; MP intersects AP at AP's maximum—parallel to the logic of averages and marginals. Use: AP gauges labour productivity and helps firms assess efficiency at different employment levels. In the short run, AP first increases due to specialization and then declines because of diminishing returns as fixed inputs become binding. 21
PYQ 2024 medium economics ID: up-board When marginal production increases, then total production increases at which rate? 1 Increasing rate 2 Constant rate 3 Diminishing rate 4 None of these Official SolutionCorrect Option:
(1)
Total Product (TP) is the integral/sum of marginal products, and the slope of the TP curve at any input level equals Marginal Product (MP). If MP is increasing, the slope of TP is rising—hence TP increases at an increasing rate (the TP curve is convex up). If MP were constant, TP would rise at a constant rate; if MP were decreasing but positive, TP would rise at a diminishing rate. 22
PYQ 2024 medium economics ID: up-board "What ought to be?" is a subject matter of 1 Positive Economics 2 Normative Economics 3 Both (A) and (B) 4 None of these Official SolutionCorrect Option:
(2)
Positive economics deals with "what is"—objective, testable statements about facts and cause–effect relationships (e.g., if price rises, quantity demanded falls). Normative economics deals with "what ought to be"—value-laden judgments and policy prescriptions based on goals or ethics (e.g., the government ought to subsidize education). Since the phrase asks about what should happen, it belongs to the domain of normative economics. 23
PYQ 2024 medium economics ID: up-board How many factors of production are there in modern age? 1 2 2 3 3 4 4 5 Official SolutionCorrect Option:
(3)
In modern economics at the Class 12 level, the factors of production are taken as four: Land, Labour, Capital, and Enterprise (also called Organisation). Land includes all natural resources; Labour denotes human effort (physical and mental); Capital means man-made productive assets; and Enterprise coordinates the other three and undertakes risk. While some discussions add "technology" as a separate input, the standard school framework recognizes these four core factors. 24
PYQ 2024 medium economics ID: up-board Explain the concepts of 'total fixed cost', 'total variable cost', and 'total cost'. Official SolutionCorrect Option:
(1)
25
PYQ 2024 medium economics ID: up-board Describe the characteristics of a 'Perfectly Competitive Market'. Official SolutionCorrect Option:
(1) A perfectly competitive market has the following key characteristics:
26
PYQ 2024 medium economics ID: up-board Explain the process of price determination of a commodity in a perfectly competitive market with the help of a diagram. Official SolutionCorrect Option:
(1) In a perfectly competitive market, the price of a commodity is determined by the interaction of supply and demand. The market price is set where the demand curve intersects the supply curve. At this price, the quantity demanded by consumers is equal to the quantity supplied by producers. Diagram Explanation: The demand curve is downward sloping, and the supply curve is upward sloping. The equilibrium price is where they intersect. Producers are price takers in perfect competition, meaning they accept the market price. 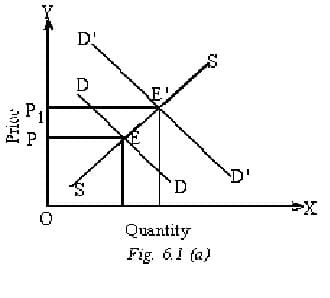 27
PYQ 2024 medium economics ID: up-board What do you mean by 'long-run' in production? Explain the laws of returns to scale. Official SolutionCorrect Option:
(1) The 'long-run' in production refers to a time period in which all factors of production can be varied, unlike the short-run where only some factors are fixed. In the long run, firms can adjust their scale of operations and production capacity. Laws of Returns to Scale: The laws of returns to scale explain how output changes when all inputs are increased proportionally. The three stages of returns to scale are: Diagram Explanation: A graph showing increasing, constant, and decreasing returns to scale can be used to illustrate this. 28
PYQ 2024 medium economics ID: up-board Describe the types of price elasticity of demand and describe the factors affecting elasticity of demand. Official SolutionCorrect Option:
(1) Price elasticity of demand (PED) refers to how sensitive the quantity demanded is to a change in price. The types of PED are:
Factors Affecting Elasticity of Demand:
29
PYQ 2024 medium economics ID: up-board Write the Law of Diminishing Marginal Productivity. Official SolutionCorrect Option:
(1) The law states that as more units of a variable input (e.g., labor) are added to a fixed input (e.g., capital), the additional output (marginal product) generated from each additional unit of the variable input eventually decreases. This happens due to the limited availability of fixed inputs. 30
PYQ 2024 medium economics ID: up-board Write the main characteristics of a market economy. Official SolutionCorrect Option:
(1) 31
PYQ 2024 medium economics ID: up-board Explain the meaning of Microeconomics. Official SolutionCorrect Option:
(1) Microeconomics studies the behavior of individual units such as consumers, firms, and industries. It focuses on demand, supply, and price determination for specific markets, analyzing how resources are allocated efficiently at the micro level. 32
PYQ 2024 medium economics ID: up-board With reference to production, short run is that situation where: 1 All the means of production can be changed. 2 All the means of production cannot be changed. 3 Both (a) and (b) are correct. 4 Both (a) and (b) are incorrect. Official SolutionCorrect Option:
(2) In the short run, at least one factor of production (e.g., capital or land) is fixed, while other factors, such as labor, can vary. 33
PYQ 2024 medium economics ID: up-board The supply curve of a firm in the short-run is generally: 1 U-shaped 2 Horizontal line 3 Vertical line 4 V-shaped Official SolutionCorrect Option:
(1) The U-shape represents the average cost curve due to economies and diseconomies of scale. This is typical in the short-run cost structure. 34
PYQ 2024 medium economics ID: up-board In a planned economy, decisions related to production and distribution are taken by: 1 Government 2 Markets 3 Corporate sector 4 Price mechanism Official SolutionCorrect Option:
(1) In a planned economy, central authorities, usually the government, determine what to produce, how to produce, and for whom to produce. 35
PYQ 2024 medium economics ID: up-board Explain Production Function. Official SolutionCorrect Option:
(1) The Production Function illustrates the relationship between the inputs (factors of production) and the output produced. It shows how much output can be generated by using a specific quantity of inputs, such as labor, capital, and raw materials. The function reflects the efficiency of input usage and helps businesses determine optimal input combinations. It is crucial in understanding how changing the quantity of inputs influences production levels. The production function typically demonstrates diminishing marginal returns as more of an input is added, assuming other factors are constant. 36
PYQ 2024 medium economics ID: up-board State the assumptions of Perfect Competition. Official SolutionCorrect Option:
(1) The assumptions of perfect competition are as follows: - Large number of buyers and sellers: There are so many firms and consumers that no single participant can influence the market price. - Homogeneous products: All products are identical, and there is no differentiation between the goods sold by different firms. - Free entry and exit: Firms can freely enter or exit the market without barriers, ensuring long-run equilibrium. - Perfect information: All buyers and sellers have complete knowledge of market conditions, prices, and product quality. - Price takers: Individual firms cannot set their own prices; they must accept the market price as given. 37
PYQ 2024 medium economics ID: up-board Which of the following determine the price under perfect competition? 1 Representative firm 2 General firm 3 Industry 4 Government Official SolutionCorrect Option:
(3) Under perfect competition, the price is determined by the industry supply and demand curves, not by any individual firm. 38
PYQ 2024 medium economics ID: up-board Demand curve shows the relationship between: 1 Cost and Price 2 Price and Sales 3 Cost and Revenue 4 Demand and Price Official SolutionCorrect Option:
(4) The demand curve shows the relationship between the quantity demanded of a good or service and its price. As price changes, the demand changes in the opposite direction, representing the inverse relationship between demand and price. 39
PYQ 2024 medium economics ID: up-board Which of the following curves is shaped like a Rectangular Hyperbola? 1 AFC curve 2 TFC curve 3 TVC curve 4 AVC curve Official SolutionCorrect Option:
(1) The AFC (Average Fixed Cost) curve is shaped like a rectangular hyperbola. It shows the inverse relationship between fixed cost and output in the short run. 40
PYQ 2024 medium economics ID: up-board Returns to Scale is related with: 1 Short period 2 Long period 3 Very short period 4 None of the above Official SolutionCorrect Option:
(2) Returns to scale refers to the changes in output when all inputs are increased proportionally. It is a long-term concept where all factors of production are variable. 41
PYQ 2024 medium economics ID: up-board What is an isoquant curve? Use isoquant curves to demonstrate producer's equilibrium. Official SolutionCorrect Option:
(1) An Isoquant curve is a graphical representation of all the combinations of two factors of production (such as labor and capital) that produce the same level of output. It is similar to an indifference curve, but instead of showing combinations of goods that give the same level of satisfaction to a consumer, it shows combinations of inputs that result in the same level of output for a producer. - Producer's Equilibrium: Producer's equilibrium occurs when a firm achieves maximum production efficiency with a given set of inputs. The producer's equilibrium can be determined using the Isoquant curve and the Isocost line. 1. Isoquant Curve: Represents all the possible combinations of factors of production that yield a given level of output. 2. Isocost Line: Represents all the combinations of factors of production that cost the same amount. The slope of the isocost line is determined by the ratio of the prices of the factors of production. The producer's equilibrium is attained at the point where the Isoquant curve is tangent to the Isocost line. At this point, the firm is using its resources most efficiently, and any change in the combination of resources would lead to a higher cost for the same level of output. 42
PYQ 2024 medium economics ID: up-board What do you understand by cost? Define Total Cost, Average Cost and Marginal Cost with diagram. Official SolutionCorrect Option:
(1) In economics, the term 'cost' refers to the expenditure incurred by a firm in the process of production. It involves the total money spent on purchasing resources like labor, raw materials, machinery, etc. - Total Cost (TC): The total cost incurred in producing a given level of output. It is the sum of total fixed costs (TFC) and total variable costs (TVC): - Average Cost (AC): The cost per unit of output, calculated by dividing the total cost by the quantity of output: - Marginal Cost (MC): The additional cost incurred by producing one more unit of output. It is calculated as the change in total cost when output is increased by one unit: 43
PYQ 2024 medium economics ID: up-board Clarify the difference between Short Period and Long Period in production. Official SolutionCorrect Option:
(1) In economic theory, the short period and long period refer to different time frames in which firms operate and adjust their production processes. The key difference between the two periods lies in the flexibility of adjusting the factors of production. Short Period:
The short period refers to a time frame during which at least one factor of production is fixed, typically capital (such as machinery or land). Firms can adjust variable factors like labor, raw materials, and energy, but they cannot change fixed factors. In the short run, production is constrained by the fixed inputs, and firms are subject to the law of diminishing returns. This law states that as more units of a variable input are added to a fixed input, the additional output produced will eventually decrease. The short period is often characterized by less efficiency due to the constraints imposed by fixed inputs. For example, a factory might be able to hire more workers (variable input) but cannot immediately buy more machines (fixed input). As more workers are added, the factory may see increasing output, but beyond a certain point, each additional worker will contribute less to overall production. Long Period:
The long period refers to a time frame in which all factors of production can be adjusted. In the long run, there are no fixed inputs, meaning firms can vary both capital and labor to achieve the most efficient level of production. Firms have the flexibility to change the scale of operations, adopt new technologies, and make adjustments to both fixed and variable inputs. This results in the ability to achieve economies of scale, where increasing the scale of production leads to lower average costs due to more efficient use of resources. In the long period, firms can adjust to changes in market conditions, innovate, and even enter or exit the market. The long-run production function exhibits increasing returns to scale at first, as firms expand and become more efficient, but eventually, diminishing returns to scale may set in as resources become overextended. Key Differences:
- Adjustment of Inputs: In the short period, only variable inputs can be adjusted, while in the long period, all inputs, including capital, can be changed.
- Efficiency: In the short period, firms often experience diminishing returns due to fixed factors, while in the long period, firms can achieve optimal efficiency through scaling and resource reallocation.
- Time Frame: The short period refers to a time frame where firms cannot fully adjust their production capacity, while in the long period, firms have sufficient time to adjust all inputs. The short and long periods represent different levels of flexibility in production processes, with the long period offering more opportunities for firms to improve efficiency and reduce costs. 44
PYQ 2024 medium economics ID: up-board Discuss the equilibrium of a firm under perfect competition in the long run. Official SolutionCorrect Option:
(1) In the long run, a firm under perfect competition achieves economic equilibrium where the firm maximizes its profits (or minimizes losses) by adjusting all its inputs, including fixed factors of production. The equilibrium is characterized by the following features: 1. Profit Maximization: In perfect competition, firms are price takers, meaning they accept the market price determined by the forces of supply and demand. The firm produces at the level where marginal cost (MC) equals marginal revenue (MR), and since price equals marginal revenue in perfect competition, this condition becomes . Firms will increase output as long as the marginal revenue from the sale of an additional unit exceeds the marginal cost of producing it. 2. Zero Economic Profit (Normal Profit): In the long run, economic profit (profit beyond the normal rate of return) tends to be zero. If firms in the industry are making an economic profit in the short run, new firms will enter the market, increasing supply and driving the price down until firms are no longer earning above-normal profits. On the other hand, if firms are making losses, some will exit the market, reducing supply and increasing the price until firms are once again earning zero economic profit. This condition is known as the long-run equilibrium in perfect competition. 3. Productive and Allocative Efficiency: In the long run, firms achieve productive efficiency, meaning they produce at the lowest possible cost, represented by the minimum point of the average cost (AC) curve. At this point, firms are utilizing resources in the most efficient manner, minimizing waste. Firms also achieve allocative efficiency, where the price consumers are willing to pay equals the marginal cost of production, . This ensures that resources are allocated to their highest valued uses, and there is no excess or shortage in the market. 4. No Incentive to Enter or Exit the Market: Once a firm reaches long-run equilibrium, there is no incentive for new firms to enter or existing firms to exit the industry. The price remains stable, and firms are earning only normal profits, which is the level required to cover the opportunity cost of resources. 5. Constant Costs Industry: In a perfectly competitive market, the long-run equilibrium typically assumes constant costs, meaning that as the industry expands, the cost of production for each firm remains the same. If the market were to experience increasing or decreasing costs, the equilibrium would shift. The long-run equilibrium for a firm under perfect competition is depicted where the MC curve intersects the AC curve at its minimum point. This is the most efficient production level, where the firm produces the output at the lowest cost, while also earning zero economic profit in the long run. 45
PYQ 2024 medium economics ID: up-board What do you understand by law of variable proportion? Official SolutionCorrect Option:
(1) The law of variable proportion states that when one factor of production is increased, keeping others constant, the total output initially increases at an increasing rate, then at a diminishing rate. 46
PYQ 2024 medium economics ID: up-board What do you understand by Micro-Economics? Official SolutionCorrect Option:
(1) Microeconomics deals with the study of individual economic agents, such as households, firms, and industries, and how they make decisions regarding the allocation of resources and the pricing of goods and services. 47
PYQ 2024 medium economics ID: up-board A production function expresses the relationship between: Options: 1 Cost and Benefit 2 Stock and Flow 3 Demand and Supply 4 Input and Output Official SolutionCorrect Option:
(4) A production function shows the relationship between the inputs used in production (such as labor, capital) and the resulting output. It helps in understanding how efficiently resources are being utilized. 48
PYQ 2024 medium economics ID: up-board What do you understand by Average Cost (AC) and Marginal Cost (MC)? Explain the mutual relation between these curves. Official SolutionCorrect Option:
(1) Average Cost (AC) refers to the total cost of production per unit of output. It is calculated by dividing the total cost (TC) by the number of units produced (Q). Mathematically, it is expressed as: where represents total cost and represents the quantity of output. Average Cost includes both fixed and variable costs, averaged over all units produced. The AC curve typically decreases initially, reflecting increasing returns to scale, but after a certain point, it starts to increase due to diminishing returns to variable inputs. Marginal Cost (MC) refers to the additional cost incurred from producing one more unit of output. It is the change in total cost resulting from a change in the level of output, and is mathematically expressed as: where is the change in total cost and is the change in the quantity of output. MC reflects how cost changes as production increases or decreases. It typically follows the law of diminishing marginal returns, meaning it initially decreases as production increases but eventually starts to increase due to inefficiencies when production exceeds optimal levels. Mutual Relation between AC and MC: The relationship between Average Cost (AC) and Marginal Cost (MC) is a key aspect of production theory. The MC curve has a crucial role in determining the behavior of the AC curve: 2. When MC is greater than AC: When the marginal cost exceeds the average cost, producing an additional unit increases the average cost. In this case, the MC curve lies above the AC curve, and the AC curve starts rising. This situation typically occurs when production exceeds the optimal capacity, leading to inefficiencies. 3. When MC equals AC: The MC curve intersects the AC curve at its minimum point. This is the point of optimal production, where average cost is at its lowest. At this point, the firm is operating at maximum efficiency in terms of cost per unit of output. The AC curve is typically U-shaped due to economies of scale (when increasing output leads to lower average costs) followed by diseconomies of scale (when increasing output leads to higher average costs). The MC curve, on the other hand, usually starts below the AC curve, rises sharply as output increases, and intersects the AC curve at its lowest point. Importance of AC and MC Curves: - Profit Maximization: Firms use these curves to decide the level of output at which they should operate to minimize costs and maximize profits. The point where MC equals AC represents the most efficient production level in the short run. - Decision Making: Understanding the relationship between AC and MC helps firms decide how much to produce. If MC is rising rapidly and exceeds AC, it signals the need to reduce output to avoid inefficiencies. Example: Consider a factory producing widgets. If the factory produces 100 widgets, the total cost (TC) is \$ 1,000, so the average cost (AC) per widget is \$ 10. If the factory decides to produce one more widget, and the additional cost (marginal cost, MC) for that widget is \$ 9, the AC of all the widgets decreases slightly because the additional cost is lower than the average cost. However, if producing the 101st widget raises the marginal cost to \$ 12, the AC of each widget will increase, signaling that the factory may be approaching its optimal production level. 49
PYQ 2024 medium economics ID: up-board Choose the correct option, with reference to the following two statements: Statement I: With an increase in prices in the country, fees in private schools increase. Statement II: Increase in school fees is unjust. 1 Statement I and Statement II both are statements of Positive economics. 2 Statement I and Statement II both are statements of Normative economics. 3 Statement I is a statement of Positive economics and Statement II is a statement of Normative economics. 4 Statement I is a statement of Normative economics and Statement II is a statement of Positive economics. Official SolutionCorrect Option:
(3) Statement I is based on an observable fact and thus is classified as Positive economics. Statement II reflects a value judgment about what "ought to be" and is categorized as Normative economics. About Microeconomics - UP-BOARD-XIIMicroeconomics is a vital chapter for UP-BOARD-XII aspirants. Mastering the concepts covered in this chapter is essential for securing a top rank. By rigorously practicing the previous year questions associated with this chapter, you can identify high-yield topics, understand the examiner's perspective, and boost your confidence during the actual exam. Frequently Asked QuestionsWhy focus on Microeconomics PYQs?Analyzing PYQs for this specific chapter reveals the most frequently tested concepts and the typical complexity of questions, allowing you to tailor your study plan efficiently. How to best use this analysis?Review the topic breakdown to see which sub-topics within Microeconomics carry the most weight. Then, tackle the questions iteratively to solidify your understanding. 1 2023 2 2023 3 2023 4 2023 5 2023 6 2023 7 2023 8 2023 9 2023 10 2023 11 2023 12 2023 13 2023 14 2023 15 2024 16 2024 17 2024 18 2024 19 2024 20 2024 21 2024 22 2024 23 2024 24 2024 25 2024 26 2024 27 2024 28 2024 29 2024 30 2024 31 2024 32 2024 33 2024 34 2024 35 2024 36 2024 37 2024 38 2024 39 2024 40 2024 41 2024 42 2024 43 2024 44 2024 45 2024 46 2024 47 2024 48 2024 49 2024 |
|---|