WBJEE-JENPAS-UG SERIES Logical-reasoning
Graphs
4 previous year questions.
Volume: 4 Ques
Yield: Medium
High-Yield Trend
1
2023 3
2022 Chapter Questions 4 MCQs
01
PYQ 2022
medium
logical-reasoning ID: wbjee-je
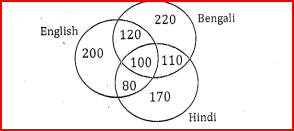
The diagram below shows the number of people who knows English, Hindi and Bengali in a district. What percentage of people knows all three languages?
1
25%
2
10%
3
30%
4
45%
02
PYQ 2022
easy
logical-reasoning ID: wbjee-je
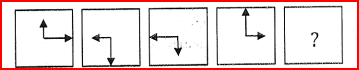
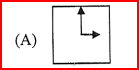
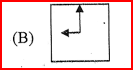
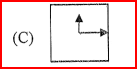
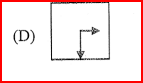
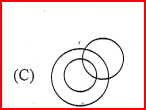
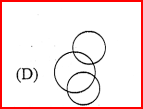
Select the correct figure from below to suit the missing figure in the sequence above.
1
2
3
4
03
PYQ 2022
medium
logical-reasoning ID: wbjee-je
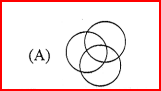
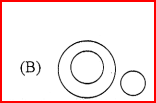
Which figure best represents the relationship among the classes Men, Authors, Teachers ?
1
2
3
4
04
PYQ 2023
medium
logical-reasoning ID: wbjee-je
Study the following graph showing the year wise turnover of a country:
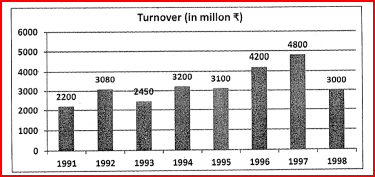
The turnover in 1997 was how many percent of that in 1994 ?
The turnover in 1997 was how many percent of that in 1994 ?
1
150%
2
200%
3
350%
4
260%
About Graphs - WBJEE-JENPAS-UG
Graphs is a vital chapter for WBJEE-JENPAS-UG aspirants. Mastering the concepts covered in this chapter is essential for securing a top rank.
By rigorously practicing the previous year questions associated with this chapter, you can identify high-yield topics, understand the examiner's perspective, and boost your confidence during the actual exam.
Frequently Asked Questions
Why focus on Graphs PYQs?
Analyzing PYQs for this specific chapter reveals the most frequently tested concepts and the typical complexity of questions, allowing you to tailor your study plan efficiently.
How to best use this analysis?
Review the topic breakdown to see which sub-topics within Graphs carry the most weight. Then, tackle the questions iteratively to solidify your understanding.