Statistics For Psychology
11 previous year questions.
High-Yield Trend
Chapter Questions 11 MCQs
| LIST I(Measures) | LIST II(Explanation) | ||
|---|---|---|---|
| A | Mean | I | The value repeated maximum number of times in a given series |
| B | Median | II | The extent of individual differences around the central tendency |
| C | Mode | III | Average |
| D | Variability | IV | The point above and below which lies 50% of the scores |
(A) Select n cases randomly (using fishbowl method or random number table)
(B) Determine the size of the present population
(C) Decide on the sample size (n)
(D) Identify sampling units in the population
Choose the correct answer from the options given below:
| LIST I(Scale of Measurement) | LIST II(Examples) | ||
|---|---|---|---|
| A | Nominal | I | Division of people on the basis of their Socio Economic Status |
| B | Ordinal | II | Diagnostic groups of Mental Disorders |
| C | Interval | III | Measurement of weight |
| D | Ratio | IV | Measurement of temperature on a centigrade scale |
(A) Population should be normally distributed
(B) Variables should be measured in Interval and/or Ratio Scale
(C) There should be many outliers
(D) Data should be based on Probability Sampling
Choose the correct answer from the options given below:
Match the LIST-I with LIST-II 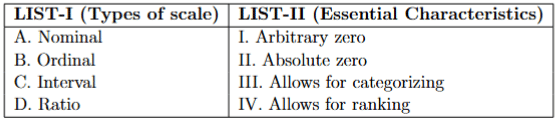
Choose the correct answer from the options given below:
Where X= Raw Score, M=Mean, SD= Standard Deviation
A. Spearman rank order correlation
B. Pearson product moment correlation
C. t-test
D. Mann-Whitney U test
Choose the correct answer from the options given below:
About Statistics For Psychology - CUET-PG
Statistics For Psychology is a vital chapter for CUET-PG aspirants. Mastering the concepts covered in this chapter is essential for securing a top rank.
By rigorously practicing the previous year questions associated with this chapter, you can identify high-yield topics, understand the examiner's perspective, and boost your confidence during the actual exam.
Frequently Asked Questions
Why focus on Statistics For Psychology PYQs?
Analyzing PYQs for this specific chapter reveals the most frequently tested concepts and the typical complexity of questions, allowing you to tailor your study plan efficiently.
How to best use this analysis?
Review the topic breakdown to see which sub-topics within Statistics For Psychology carry the most weight. Then, tackle the questions iteratively to solidify your understanding.