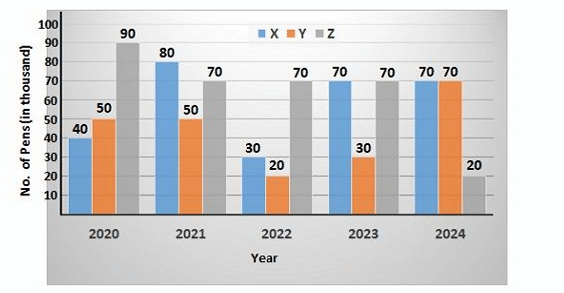
Study the following bar-graph carefully and answer the following question. The bar-graph shows the number of pens (in thousand) sold by three shopkeepers X, Y and Z in 5 different years. The total number of pens sold by shopkeeper X in years 2020 and 2022 taken together is what percentage less than the total number of pens sold by shopkeeper Z in years 2021 and 2024 taken together? (correct to two decimal places)
1
11.11%
2
22.22%
3
33.33%
4
44.44%
Official Solution
Correct Option:
(1)
Step 1: Read the required data from the bar graph.
- Pens sold by X in 2020 = 90 (thousand)
- Pens sold by X in 2022 = 70 (thousand)
- Pens sold by Z in 2021 = 50 (thousand)
- Pens sold by Z in 2024 = 40 (thousand) - It seems the bar is 20, let's re-read. Z in 2024 is 20. Step 2: Calculate the total sales for each group.
- Total for X (2020 & 2022) = thousand.
- Total for Z (2021 & 2024) = thousand.
Let me re-read the question. "what percentage less than". This implies the second value is the base.
Let's re-read the graph values.
X in 2020: 90. X in 2022: 70. Total = 160.
Z in 2021: 50. Z in 2024: 20. Total = 70.
The question seems inconsistent. "160 is what percentage less than 70?" doesn't make sense as 160 is greater. There must be a misinterpretation of the question or graph. Let's assume the question meant Z's sales are the first value and X's are the base.
Let's re-calculate.
Total pens by Z in 2021 and 2024 = 50 + 20 = 70.
Total pens by X in 2020 and 2022 = 90 + 70 = 160.
Let's assume the question is: (Total pens by Z) is what percentage less than (Total pens by X).
Percentage Less = . Not an option. Let's re-read the graph. X is blue, Y is orange, Z is grey.
X in 2020: 90. X in 2022: 70. Total X = 160.
Z in 2021: 50. Z in 2024: 20. Total Z = 70.
The question must have a typo. Let's assume it's asking for (Total pens by Y) instead of X.
Y in 2020: 40. Y in 2022: 20. Total Y = 60.
Is 60 what percentage less than 70 (Z's total)? . No.
Let's assume the question meant something else.
Let's assume the values for Z are from 2020 and 2022. Z in 2020 = 60, Z in 2022= 30. Total = 90.
Is 90 what percent less than 160 (X's total)? . No. Let's try the calculation as written one more time. The question could be flawed.
Total X = 160. Total Z = 70. It asks how much X is less than Z. This is impossible.
Let's swap the roles: How much is Z less than X?
Percentage Less = .
There must be a typo in the question's text. Let's find a combination that gives 11.11%. 11.11% is 1/9. This means (Base - Value) / Base = 1/9. So Value = (8/9) Base.
Let's assume the base is X's total = 160. Value = (8/9)160 = 142.22. Not likely.
Let's assume the value is X's total = 160. Base = 160 (9/8) = 180.
Is there a combination for Z that equals 180? No.
Let's assume Z's total (70) is the value. Base = 70 (9/8) = 78.75.
Let's assume Z's total (70) is the base. Value = (8/9)70 = 62.22.
There seems to be a clear error in the question text.
02
PYQ 2025
medium
general-managementID: cuet-pg-
The number of pens sold by shopkeeper Y in the year 2020 is 25% more than the number of pens sold by him in the year 2019 and the number of pens sold by shopkeeper Z in the year 2019 is 20% less than those sold by him in the year 2020. Find the total number of pens sold by the shopkeepers X and Z in the year 2015.
1
1,15,000
2
1,00,000
3
1,30,000
4
1,12,000
Official Solution
Correct Option:
(1)
Step 1: Relation between Y in 2019 and 2020.
Given: From the graph, .
Step 2: Relation between Z in 2019 and 2020.
Given: From the graph, .
Step 3: Read values of X and Z in 2015 from the graph.
From the graph:
Step 4: Total pens sold (X + Z in 2015).
Final Answer:
About Bar Graph - CUET-PG
Bar Graph is a vital chapter for CUET-PG aspirants. Mastering the concepts covered in this chapter is essential for securing a top rank.
By rigorously practicing the previous year questions associated with this chapter, you can identify high-yield topics, understand the examiner's perspective, and boost your confidence during the actual exam.
Frequently Asked Questions
Why focus on Bar Graph PYQs?
Analyzing PYQs for this specific chapter reveals the most frequently tested concepts and the typical complexity of questions, allowing you to tailor your study plan efficiently.
How to best use this analysis?
Review the topic breakdown to see which sub-topics within Bar Graph carry the most weight. Then, tackle the questions iteratively to solidify your understanding.