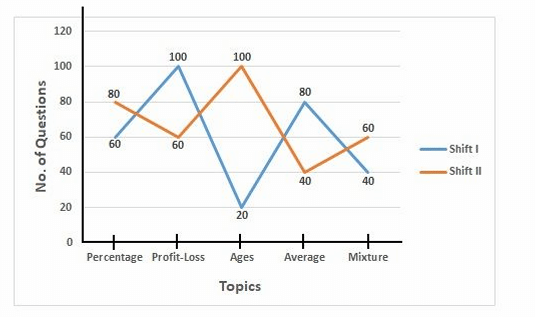
The following line graph shows the number of questions asked from different topics of quantitative aptitude in two shifts of CAT exam. What is the ratio of number of questions asked from the topics Profit-Loss and Percentage taken together in shift I to those asked from the topics Ages and Average taken together in shift II?
1
7:6
2
7:5
3
8:7
4
8:3
Official Solution
Correct Option:
(1)
Step 1: From the line graph (Shift I values).
Profit & Loss = 10, Percentage = 12
Step 2: From the line graph (Shift II values).
Ages = 8, Average = 10
Step 3: Ratio calculation.
Step 4: Closest option.
Hence, the correct option is (A) 7:6.
Final Answer:
02
PYQ 2025
medium
general-managementID: cuet-pg-
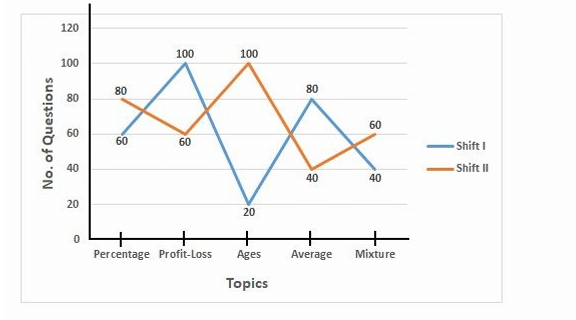
The following line graph shows the number of questions asked from different topics of quantitative aptitude in two shifts of CAT exam. The number of questions asked in shift I from the topic Profit-Loss is what percent more than the number of questions asked in shift II from the topic Average?
1
250%
2
180%
3
120%
4
150%
Official Solution
Correct Option:
(4)
Step 1: Read the required values from the line graph.
- Number of questions from Profit-Loss in Shift I (Blue line) = 100.
- Number of questions from Average in Shift II (Orange line) = 40.
Step 2: Calculate the percentage difference using the formula: .
The base for comparison is the 'Average in Shift II'.
Percentage More = .
About Line Graphs - CUET-PG
Line Graphs is a vital chapter for CUET-PG aspirants. Mastering the concepts covered in this chapter is essential for securing a top rank.
By rigorously practicing the previous year questions associated with this chapter, you can identify high-yield topics, understand the examiner's perspective, and boost your confidence during the actual exam.
Frequently Asked Questions
Why focus on Line Graphs PYQs?
Analyzing PYQs for this specific chapter reveals the most frequently tested concepts and the typical complexity of questions, allowing you to tailor your study plan efficiently.
How to best use this analysis?
Review the topic breakdown to see which sub-topics within Line Graphs carry the most weight. Then, tackle the questions iteratively to solidify your understanding.