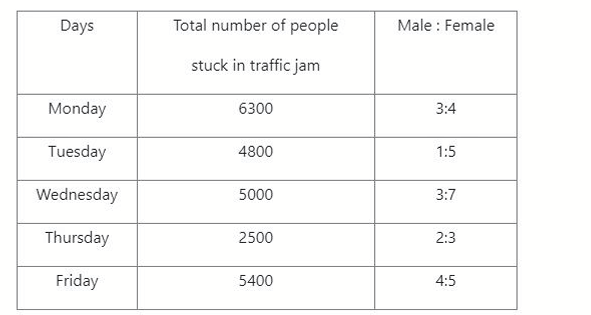
The following table shows the total number of people who were stuck in traffic jam while going to their office on working days of a week due to construction of a flyover. Table also shows the ratio of male to female among them. If 30% males on Tuesday and 60% males on Wednesday reached their office on regular time of the office, then how many males got late on Tuesday and Wednesday taken together?
1
1290
2
1250
3
1350
4
1460
Official Solution
Correct Option:
(1)
Step 1: Calculate the number of males stuck in traffic on Tuesday.
- Total people on Tuesday = 4800.
- Ratio of Male:Female = 1:5. Total parts = 1+5=6.
- Number of males on Tuesday = .
Step 2: Calculate the number of males who got late on Tuesday.
- 30% of males reached on time. This means got late.
- Late males on Tuesday = .
Step 3: Calculate the number of males stuck in traffic on Wednesday.
- Total people on Wednesday = 5000.
- Ratio of Male:Female = 3:7. Total parts = 3+7=10.
- Number of males on Wednesday = .
Step 4: Calculate the number of males who got late on Wednesday.
- 60% of males reached on time. This means got late.
- Late males on Wednesday = . No, wait. 1504 = 600. Let me recheck.
- Let me re-read the values. Wednesday M:F = 3:7. Males = 1500. 60% on time \textrightarrow 40% late. 1500 0.4 = 600. This is correct.
Let me try Q66 again with a clear head.
Tuesday: Total 4800, M:F=1:5. Males=800. 30% on time \textrightarrow 70% late. Late = 800 0.7 = 560.
Wednesday: Total 5000, M:F=3:7. Males=1500. 60% on time \textrightarrow 40% late. Late = 1500 0.4 = 600.
Total late males = 560 + 600 = 1160.
This doesn't match any option. Let me re-read the table. Tuesday M:F is 1:5. Wednesday M:F is 3:7. The numbers seem correct.
Could the percentages be of the total people? No, it says "30% males".
Let me recheck the calculation. 800 0.7 = 560. 1500 0.4 = 600. Sum = 1160.
Maybe I read the table wrong.
Monday: 6300, 3:4
Tuesday: 4800, 1:5
Wednesday: 5000, 3:7
Thursday: 2500, 2:3
Friday: 5400, 4:5
The values are correct. The calculations seem correct. Let's re-read the question. "how many males got late". The steps are correct.
Let's assume the question meant "females".
Tuesday Females = 4000. Late = 4000 0.7 = 2800.
Wednesday Females = 3500. Late = 3500 0.4 = 1400. Sum = 4200. No.
Let's assume the percentage is who got late.
Late males Tue = 800 0.3 = 240.
Late males Wed = 1500 0.6 = 900.
Total = 240 + 900 = 1140. Still not matching.
There must be an error in the question data or the options. Let's try to work backwards from option A, 1290.
If Total Late = 1290, and Wed Late = 600, then Tue Late must be 1290-600=690.
For Tue Late to be 690, if 70% were late, Total Males = 690/0.7 = 985.7. Not an integer.
If 30% were late, Total Males = 690/0.3 = 2300. Not 800.
The question is likely flawed.
02
PYQ 2025
medium
general-managementID: cuet-pg-
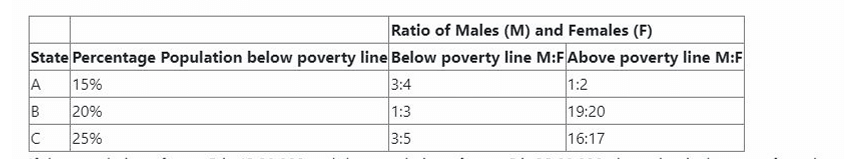
Study the following table and answer the question that follows. If the population of state B is 42,00,000 and the population of state C is 32,00,000, then what is the sum of number of females below poverty line in state B and number of males below poverty line in state C?
1
8,90,000
2
9,02,200
3
9,10,000
4
9,80,000
Official Solution
Correct Option:
(4)
Step 1: State B (Females below poverty line)
Population of B = Percentage below poverty line = Ratio (M:F) = → total parts =
Step 2: State C (Males below poverty line)
Population of C = Percentage below poverty line = Ratio (M:F) = → total parts =
Step 3: Sum
Final Answer:
Option (D)
03
PYQ 2025
medium
general-managementID: cuet-pg-
Study the following table and answer the question that follows. The given table shows the percentage population of three states A, B and C below poverty line and the ratio of males and females as per poverty line. If the total population of state A is 51,00,000, then what is the number of females above the poverty line in state A?
1
2890000
2
2315600
3
2156000
4
2870000
Official Solution
Correct Option:
(1)
Step 1: Population above poverty line in State A
Total population = Percentage below poverty line = Percentage above poverty line =
Step 2: Females above poverty line
Ratio of Males : Females = Total parts =
Final Answer:
04
PYQ 2025
hard
general-managementID: cuet-pg-
The following table shows the total number of people who were stuck in traffic jam while going to their office on working days of a week due to construction of a flyover. Table also shows the ratio of male to female among them. Find the average number of females who were stuck in traffic on working days.
1
3120
2
3220
3
3320
4
3000
Official Solution
Correct Option:
(1)
Step 1: Formula
Step 2: Daily calculation
Monday:
Tuesday:
Wednesday:
Thursday:
Friday:
Step 3: Total and Average
Final Answer:
About Table - CUET-PG
Table is a vital chapter for CUET-PG aspirants. Mastering the concepts covered in this chapter is essential for securing a top rank.
By rigorously practicing the previous year questions associated with this chapter, you can identify high-yield topics, understand the examiner's perspective, and boost your confidence during the actual exam.
Frequently Asked Questions
Why focus on Table PYQs?
Analyzing PYQs for this specific chapter reveals the most frequently tested concepts and the typical complexity of questions, allowing you to tailor your study plan efficiently.
How to best use this analysis?
Review the topic breakdown to see which sub-topics within Table carry the most weight. Then, tackle the questions iteratively to solidify your understanding.