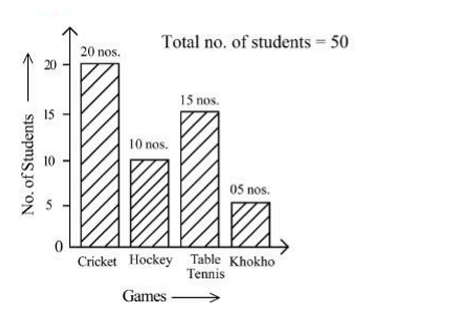
As per the given bar chart, what is the total percentage of students who prefer to play cricket?
1
15%
2
20%
3
30%
4
40%
Official Solution
Correct Option:
(4)
Step 1: Reading the data from the bar chart. From the bar chart, the number of students who prefer different games is given as follows: Cricket = 20 students Hockey = 10 students Table Tennis = 15 students Khokho = 5 students The total number of students is clearly mentioned as 50.
Step 2: Identifying the number of students preferring cricket. According to the chart, 20 students prefer to play cricket.
Step 3: Calculating the percentage.
Step 4: Conclusion. The total percentage of students who prefer to play cricket is 40%.
02
PYQ 2025
medium
aptitudeID: jee-main
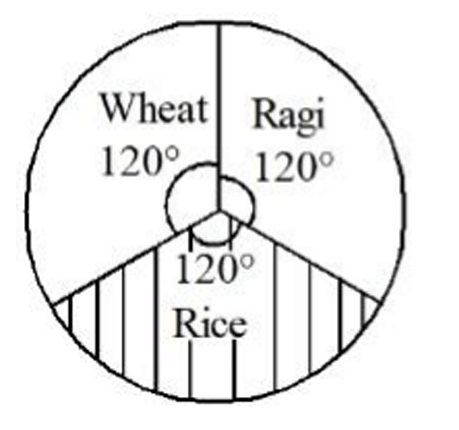
As per the given pie chart, identify the percentage (%) of the shaded portion.
1
22.22%
2
45.55%
3
33.33%
4
11.11%
Official Solution
Correct Option:
(3)
Step 1: Understanding the pie chart. The pie chart is divided into three equal sectors representing Wheat, Ragi, and Rice. Each sector has an angle of , as clearly shown in the diagram.
Step 2: Identifying the shaded portion. The shaded portion corresponds to the Rice sector, which measures .
Step 3: Calculating the percentage. The total angle of a pie chart is .
Step 4: Conclusion. The percentage of the shaded portion shown in the pie chart is 33.33%.
About Data Interpretation - JEE-MAIN
Data Interpretation is a vital chapter for JEE-MAIN aspirants. Mastering the concepts covered in this chapter is essential for securing a top rank.
By rigorously practicing the previous year questions associated with this chapter, you can identify high-yield topics, understand the examiner's perspective, and boost your confidence during the actual exam.
Frequently Asked Questions
Why focus on Data Interpretation PYQs?
Analyzing PYQs for this specific chapter reveals the most frequently tested concepts and the typical complexity of questions, allowing you to tailor your study plan efficiently.
How to best use this analysis?
Review the topic breakdown to see which sub-topics within Data Interpretation carry the most weight. Then, tackle the questions iteratively to solidify your understanding.