BIHAR-BOARD-XII SERIES Physics
Optics
29 previous year questions.
Volume: 29 Ques
Yield: High
High-Yield Trend
8
2025 8
2024 13
2023 Chapter Questions 29 MCQs
01
PYQ 2023
medium
physics ID: bihar-bo
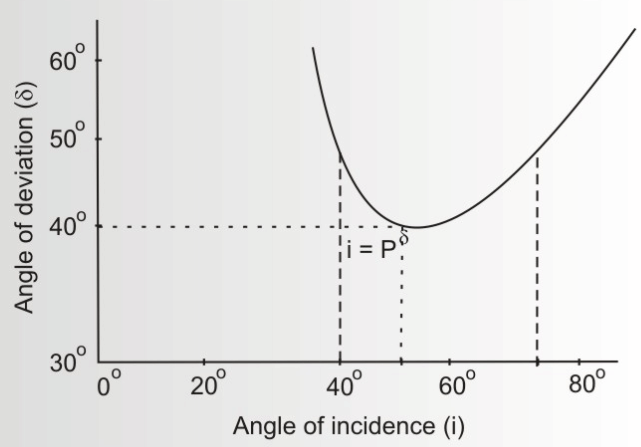
Draw graph between the angle of incidence and angle of deviation by using prism. Determine angle of minimum deviation ( ).
02
PYQ 2023
medium
physics ID: bihar-bo
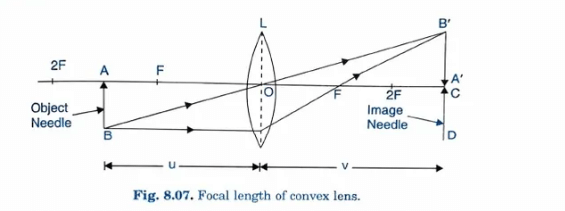
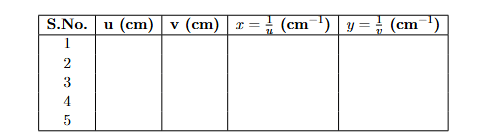
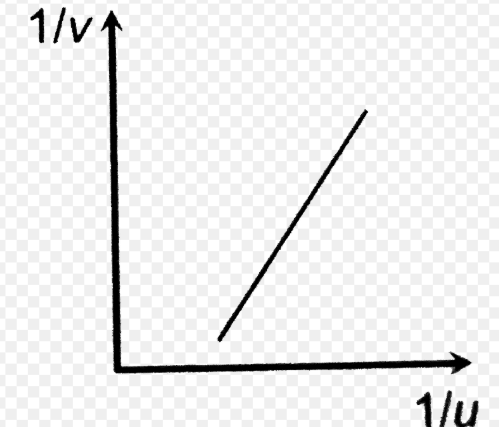
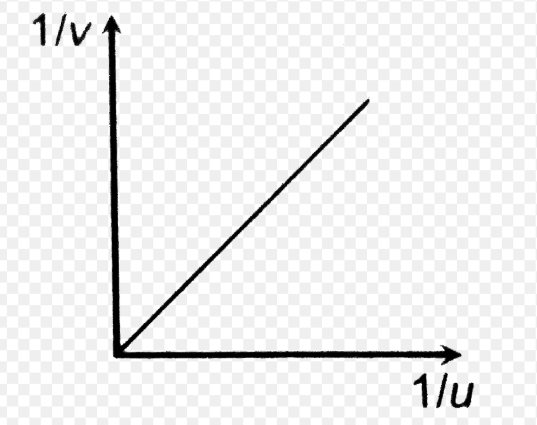
Find the focal length of the given convex lens by plotting graph between u and v.
03
PYQ 2023
medium
physics ID: bihar-bo
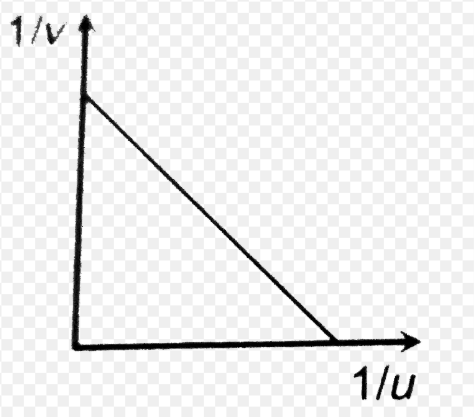
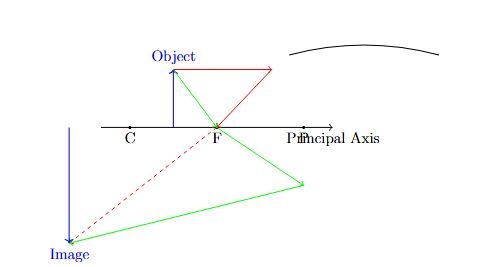
Plot the graph between and for the given concave mirror and then evaluate focal length by graph.
04
PYQ 2023
medium
physics ID: bihar-bo
Observe polarization of light due to a thin slit.
05
PYQ 2023
medium
physics ID: bihar-bo
Obtain a lens combination with the specified focal length using two lenses from the given lens.
06
PYQ 2023
medium
physics ID: bihar-bo
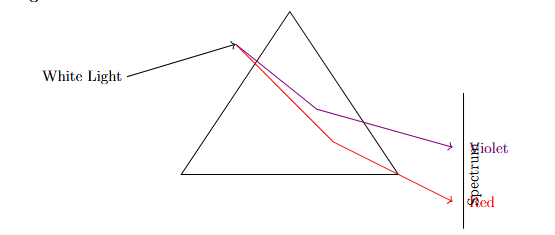
Demonstrate dispersion of light after passing a white light through a prism.
07
PYQ 2023
medium
physics ID: bihar-bo
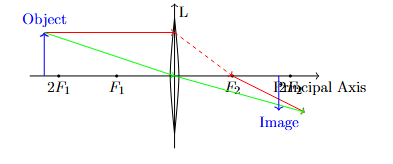
Show formation of image (nature and size) by a convex lens with the help of a screen and candle.
08
PYQ 2023
medium
physics ID: bihar-bo
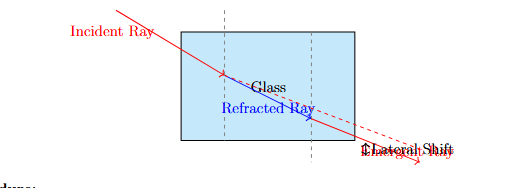
Show lateral deviation of a beam of light incident obliquely on a glass slab.
09
PYQ 2023
medium
physics ID: bihar-bo
Show the formation of image by a concave mirror using a candle and a screen.
10
PYQ 2023
medium
physics ID: bihar-bo
Determine the refractive index of the material of prism.
11
PYQ 2023
medium
physics ID: bihar-bo
Find the focal length of convex mirror using convex lens.
12
PYQ 2023
medium
physics ID: bihar-bo
Determine the refractive index of a glass slab using a travelling microscope.
13
PYQ 2023
medium
physics ID: bihar-bo
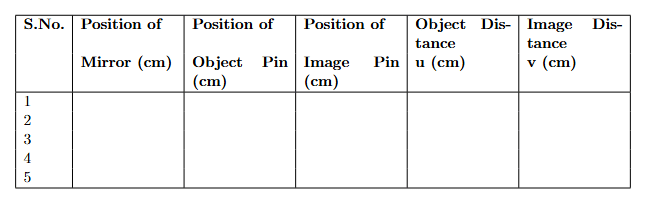
Find the focal length of given concave mirror by using two-pin method.
14
PYQ 2024
medium
physics ID: bihar-bo
Convex lens is used in:
1
short-sightedness
2
long-sightedness
3
presbyopia
4
astigmatism
15
PYQ 2024
medium
physics ID: bihar-bo
The colour of the sky is blue due to:
1
interference
2
scattering
3
diffraction
4
polarisation
16
PYQ 2024
medium
physics ID: bihar-bo
A large virtual image of an object is formed by:
1
concave mirror
2
convex mirror
3
plane mirror
4
concave lens
17
PYQ 2024
medium
physics ID: bihar-bo
Powers of two lenses kept in contact are and . The power of the equivalent lens will be:
1
2
3
4
18
PYQ 2024
medium
physics ID: bihar-bo
The wavelength of which colour is minimum?
1
Violet
2
Blue
3
Yellow
4
Red
19
PYQ 2024
medium
physics ID: bihar-bo
Which causes the formation of rainbow?
1
Diffraction
2
Scattering
3
Refraction
4
Dispersion
20
PYQ 2024
medium
physics ID: bihar-bo
The image formed in a compound microscope is:
1
real and erect
2
real and inverted
3
virtual and inverted
4
virtual and erect
21
PYQ 2024
medium
physics ID: bihar-bo
The image of any object formed at the retina of the human eye is:
1
real and inverted
2
real and erect
3
virtual and erect
4
virtual and inverted
22
PYQ 2025
easy
physics ID: bihar-bo
What is equivalent lens? Derive an expression for equivalent focal length of two lenses of focal lengths and kept at a distance .
23
PYQ 2025
medium
physics ID: bihar-bo
If the critical angle for total internal reflection from any medium to vacuum is 30°, then the velocity of light in the medium is.
1
2
3
4
24
PYQ 2025
medium
physics ID: bihar-bo
What is photoelectric effect? What are the laws of photoelectric effect? Explain this law given by Einstein.
25
PYQ 2025
medium
physics ID: bihar-bo
Write the necessary conditions for total internal reflection of light.
26
PYQ 2025
medium
physics ID: bihar-bo
How does refractive index of any medium depend upon the wavelength of light?
27
PYQ 2025
medium
physics ID: bihar-bo
A convex lens is dipped in a liquid, whose refractive index is equal to the refractive index of the material of the lens. Then its focal length will
1
become zero
2
become infinity
3
reduce
4
increase
28
PYQ 2025
medium
physics ID: bihar-bo
The bubble of soap appears coloured due to
1
diffraction
2
polarization
3
interference
4
reflection
29
PYQ 2025
medium
physics ID: bihar-bo
A person uses spectacles (lens) of +2D power. His defect of vision is.
1
Myopia
2
Hypermetropia
3
Presbyopia
4
Astigmatism
About Optics - BIHAR-BOARD-XII
Optics is a vital chapter for BIHAR-BOARD-XII aspirants. Mastering the concepts covered in this chapter is essential for securing a top rank.
By rigorously practicing the previous year questions associated with this chapter, you can identify high-yield topics, understand the examiner's perspective, and boost your confidence during the actual exam.
Frequently Asked Questions
Why focus on Optics PYQs?
Analyzing PYQs for this specific chapter reveals the most frequently tested concepts and the typical complexity of questions, allowing you to tailor your study plan efficiently.
How to best use this analysis?
Review the topic breakdown to see which sub-topics within Optics carry the most weight. Then, tackle the questions iteratively to solidify your understanding.