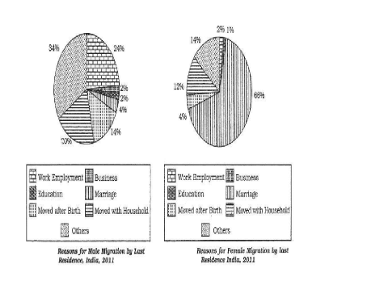
Study the given diagram and answer the following question. Which is the leading cause of male migration in India ?
1
Marriage
2
Business
3
Education
4
Work Employment
Official Solution
Correct Option:
(4)
From the pie chart, it is clear that the leading cause for male migration is "Work Employment," which accounts for 34% of the total migration. This is the largest segment compared to others like Marriage, Business, and Education.
02
PYQ 2023
medium
geographyID: cuet-ug-
Study the given diagram and answer the following question. Which is the leading cause of female migration in India ?
1
Education
2
Business
3
Marriage
4
Work Employment
Official Solution
Correct Option:
(3)
The pie chart clearly shows that Marriage is the leading cause of female migration, accounting for 66% of total female migration. Education and Business account for smaller proportions.
03
PYQ 2023
medium
geographyID: cuet-ug-
Study the given diagram and answer the following question. The diagram used to represent the relative share of reasons of migration is known as ...........
1
Percentage bar diagram
2
Pie diagram
3
Proportional circle diagram
4
Flow diagram
Official Solution
Correct Option:
(2)
The given diagram in the question is a pie diagram. A pie diagram is used to represent the relative share of different categories in a whole. The segments (or slices) represent different categories, and their size corresponds to the proportion or percentage that each category contributes to the whole.
04
PYQ 2023
medium
geographyID: cuet-ug-
Study the given diagram and answer the following question. Which one of the following represents the percentage share of male migration due to education reason?
1
2%
2
34%
3
1%
4
14%
Official Solution
Correct Option:
(1)
From the given pie chart for male migration, the percentage share of male migration due to education is represented by the section that is labeled with "Education." This percentage corresponds to 2% of the total migration.
05
PYQ 2023
medium
geographyID: cuet-ug-
Study the given diagram and answer the following question. The percentage share for different reasons of female migration is calculated by dividing the number of associated female migrants with ..........
1
Total population of India
2
Total female population
3
Total female migrants of India
4
Total migrants of India
Official Solution
Correct Option:
(3)
The percentage share for different reasons of female migration is calculated by dividing the number of associated female migrants with the total female migrants of India. This gives us the relative share of each cause for female migration.
About Pie Charts - CUET-UG
Pie Charts is a vital chapter for CUET-UG aspirants. Mastering the concepts covered in this chapter is essential for securing a top rank.
By rigorously practicing the previous year questions associated with this chapter, you can identify high-yield topics, understand the examiner's perspective, and boost your confidence during the actual exam.
Frequently Asked Questions
Why focus on Pie Charts PYQs?
Analyzing PYQs for this specific chapter reveals the most frequently tested concepts and the typical complexity of questions, allowing you to tailor your study plan efficiently.
How to best use this analysis?
Review the topic breakdown to see which sub-topics within Pie Charts carry the most weight. Then, tackle the questions iteratively to solidify your understanding.