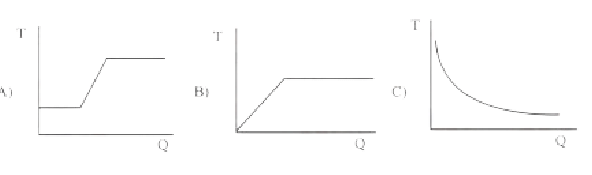
When ice at is heated and converted into steam at , which graph correctly represents the variation of temperature with heat supplied?
1
1
2
2
3
3
Official Solution
Correct Option:
(2)
Step 1: Understanding the Concept:
The process of heating ice at all the way to steam at involves three distinct thermodynamic stages.
It involves a phase change from solid to liquid, a pure temperature increase of the liquid, and finally a phase change from liquid to gas. Step 2: Key Formula or Approach:
During a phase change, heat is strictly supplied as latent heat ( ), and the absolute temperature remains entirely constant, leading to a horizontal line on a Temperature vs. Heat graph.
During a single-phase temperature rise, heat goes into specific heat capacity ( ), causing the temperature to rise linearly with a constant positive slope. Step 3: Detailed Explanation:
Let's trace the correct physical sequence of the heating curve:
Stage 1: Ice at melts into liquid water at . The temperature strictly remains constant at as heat is continuously supplied. This produces a horizontal line segment starting right from the origin along the heat axis.
Stage 2: The liquid water is then heated from up to . The temperature continuously rises linearly as more heat is supplied, creating a diagonal straight line moving upward.
Stage 3: The water at begins to boil and convert entirely into steam. The temperature remains completely constant at during this entire process, forming a second horizontal line segment.
Looking strictly at the provided visual options, Graph B is the only graph that perfectly depicts this exact "horizontal-diagonal-horizontal" sequence starting from the origin. Step 4: Final Answer:
Graph B correctly represents the exact variation of temperature with the heat supplied.
About Change Of State - KEAM
Change Of State is a vital chapter for KEAM aspirants. Mastering the concepts covered in this chapter is essential for securing a top rank.
By rigorously practicing the previous year questions associated with this chapter, you can identify high-yield topics, understand the examiner's perspective, and boost your confidence during the actual exam.
Frequently Asked Questions
Why focus on Change Of State PYQs?
Analyzing PYQs for this specific chapter reveals the most frequently tested concepts and the typical complexity of questions, allowing you to tailor your study plan efficiently.
How to best use this analysis?
Review the topic breakdown to see which sub-topics within Change Of State carry the most weight. Then, tackle the questions iteratively to solidify your understanding.