Identify 'A' in the given graph of population growth:
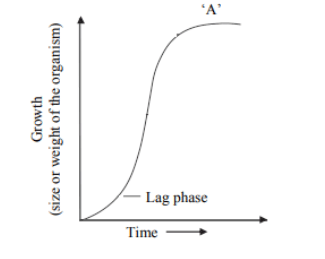
Official Solution
Correct Option: (1)
Step 1: Understanding the graph of population growth.
The graph represents typical population growth, with different phases of growth. The 'lag phase' refers to the initial phase where the population is adjusting to the environment, and growth is slow. 'A' typically represents the exponential growth phase, where the population grows at a rapid rate. Step 2: Conclusion.
The point 'A' in the graph represents the "exponential growth phase," where the population increases rapidly after overcoming the lag phase.
02
PYQ 2024
easy
biologyID: maharash
Explain the term Emigration.
Official Solution
Correct Option: (1)
Emigration is one of the factors that influence population dynamics and affects the size of a population. (i) It refers to the permanent movement of individuals out of a population, reducing the population size. (ii) Emigration is an important component of population ecology, influencing genetic diversity, resource competition, and species distribution. (iii) It is commonly observed in animals migrating to find food, escape harsh environmental conditions, or seek better breeding grounds. Examples of Emigration: Bird Migration: Birds leave colder regions in winter to migrate to warmer places. Wildebeest Migration: Large herds of wildebeest migrate seasonally to find fresh grazing areas. Human Emigration: People migrate from rural to urban areas for better job opportunities.
03
PYQ 2024
medium
biologyID: maharash
Identify the appropriate term for the number of births under ideal conditions:
1
Absolute mortality
2
Realized natality
3
Realized mortality
4
Absolute natality
Official Solution
Correct Option: (4)
Absolute natality is the maximum potential birth rate that can be achieved under ideal circumstances, with no restricting factors impacting reproduction.
04
PYQ 2025
medium
biologyID: maharash
Observe the graph and select correct option :
1
Line 'A' represents
2
Line 'B' represents
3
Line A represents
4
Line B represents
Official Solution
Correct Option: (3)
The graph shows the species-area relationship, which describes how the number of species (S) found in an area (A) increases with the size of that area.
The relationship was described by the naturalist Alexander von Humboldt with the equation:
where S = Species richness, A = Area, C = Y-intercept, and Z = slope of the line.
When plotted on normal axes, this equation gives a rectangular hyperbola, which is represented by Line A.
When plotted on a log-log scale, the equation becomes linear:
This linear relationship is represented by Line B.
Option (C) correctly identifies the equation for the curve shown as Line A. The other options misrepresent the equations.