Doppler Effect
10 previous year questions.
High-Yield Trend
Chapter Questions 10 MCQs
A sound source, emitting sound of constant frequency, moves with a constant speed and crosses a stationary observer. The frequency of sound heard by the observer is plotted against time . Which of the following graphs represents the correct variation?
A source of sound S emitting waves of frequency 100Hz and an observer O are located at some distance from each other. The source is moving with a speed of 19.4m s⁻1 at an angle of with the source–observer line as shown. The observer is at rest. The apparent frequency observed is (velocity of sound in air =330m s⁻1): 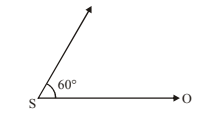
A source of sound S emitting waves of frequency 100Hz and an observer O are located at some distance from each other. The source is moving with a speed of 19.4m s⁻1 at an angle of 60^∘ with the source–observer line as shown in the figure. The observer is at rest. Find the apparent frequency observed by the observer. (Velocity of sound in air =330m s⁻1). 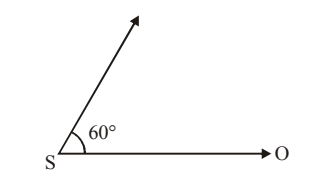
About Doppler Effect - BITSAT
Doppler Effect is a vital chapter for BITSAT aspirants. Mastering the concepts covered in this chapter is essential for securing a top rank.
By rigorously practicing the previous year questions associated with this chapter, you can identify high-yield topics, understand the examiner's perspective, and boost your confidence during the actual exam.
Frequently Asked Questions
Why focus on Doppler Effect PYQs?
Analyzing PYQs for this specific chapter reveals the most frequently tested concepts and the typical complexity of questions, allowing you to tailor your study plan efficiently.
How to best use this analysis?
Review the topic breakdown to see which sub-topics within Doppler Effect carry the most weight. Then, tackle the questions iteratively to solidify your understanding.