WBJEE SERIES Physics
First Law Of Thermodynamics
2 previous year questions.
Volume: 2 Ques
Yield: Medium
High-Yield Trend
1
2026 1
2023 Chapter Questions 2 MCQs
01
PYQ 2023
hard
physics ID: wbjee-20
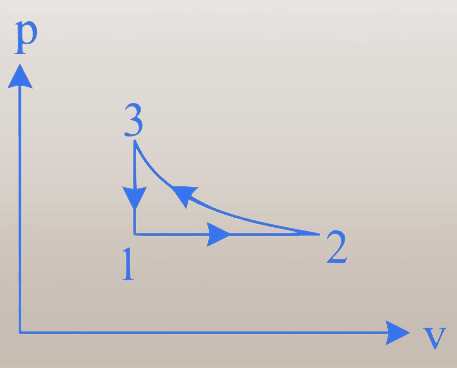
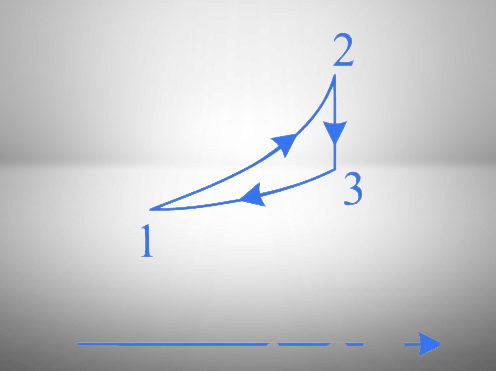
A cyclic process is shown in the p-v diagram and T-S diagram. Which of the following statement(s) is/are true?
1
1 2: Isobaric,2 3:Isothermal
2
3 1:Isochoric,2 3:adiabatic
3
Work done by the system in the complete cyclic process in non-zero.
4
The heat absorbed by the system in the complete cyclic process is non-zero.
02
PYQ 2026
medium
physics ID: wbjee-20
Adiabatic free expansion of ideal gas must be
1
Isobaric
2
Isochoric
3
Isothermal
4
Isentropic
About First Law Of Thermodynamics - WBJEE
First Law Of Thermodynamics is a vital chapter for WBJEE aspirants. Mastering the concepts covered in this chapter is essential for securing a top rank.
By rigorously practicing the previous year questions associated with this chapter, you can identify high-yield topics, understand the examiner's perspective, and boost your confidence during the actual exam.
Frequently Asked Questions
Why focus on First Law Of Thermodynamics PYQs?
Analyzing PYQs for this specific chapter reveals the most frequently tested concepts and the typical complexity of questions, allowing you to tailor your study plan efficiently.
How to best use this analysis?
Review the topic breakdown to see which sub-topics within First Law Of Thermodynamics carry the most weight. Then, tackle the questions iteratively to solidify your understanding.