Data Interpretation
13 previous year questions.
High-Yield Trend
Chapter Questions 13 MCQs
A pie chart shows the allocation of a 260 lakh annual budget among 5 departments. If the Health department gets 18% and Education gets 24%, how much more does Education get than Health? 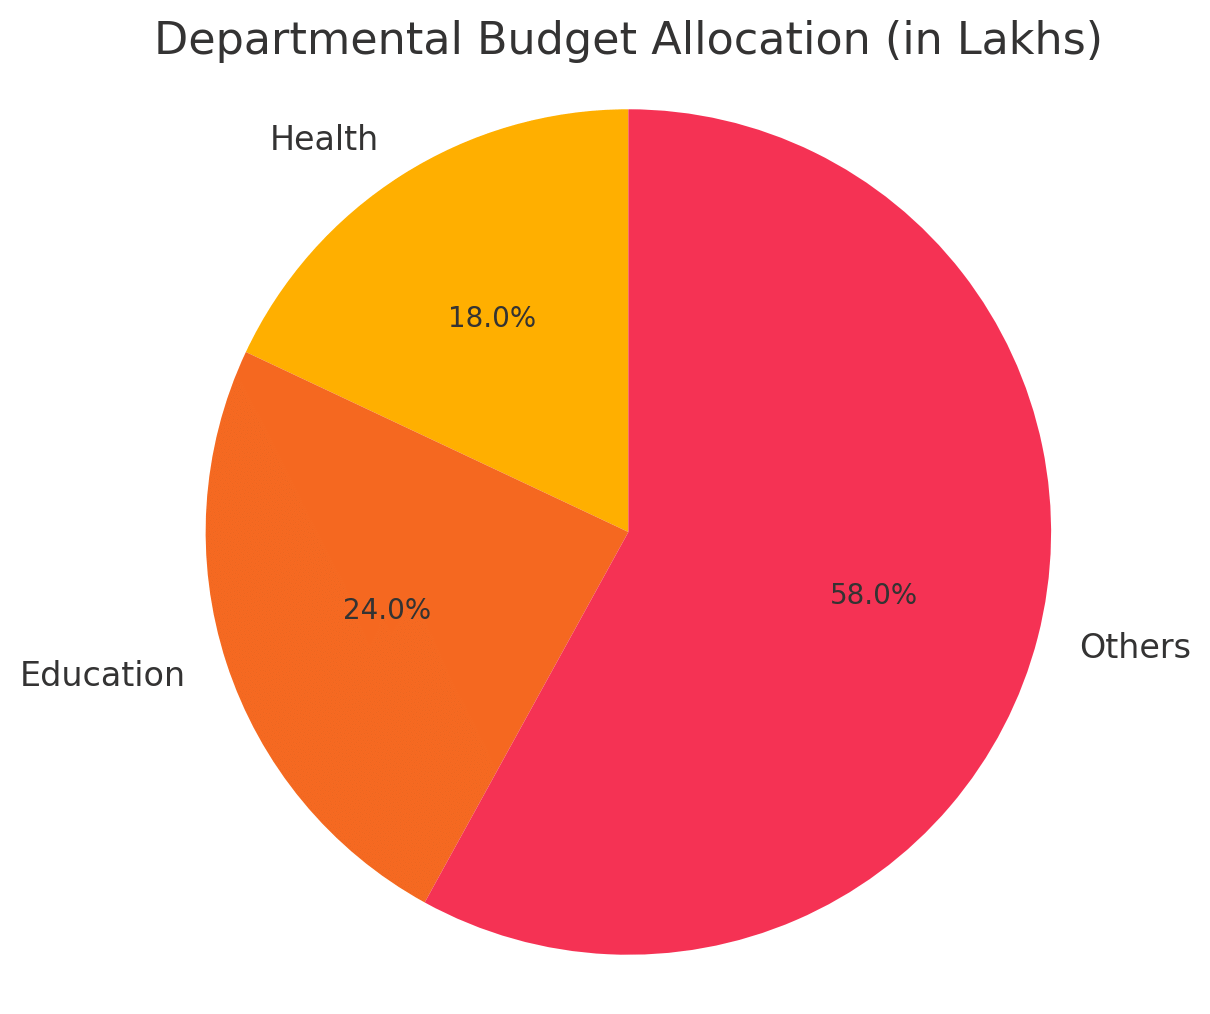
A pie chart shows the distribution of students across 5 faculties in a university. If 20% are in Arts, 25% in Science, 15% in Law, 30% in Engineering, and the rest in Commerce, what is the angle (in degrees) for Commerce?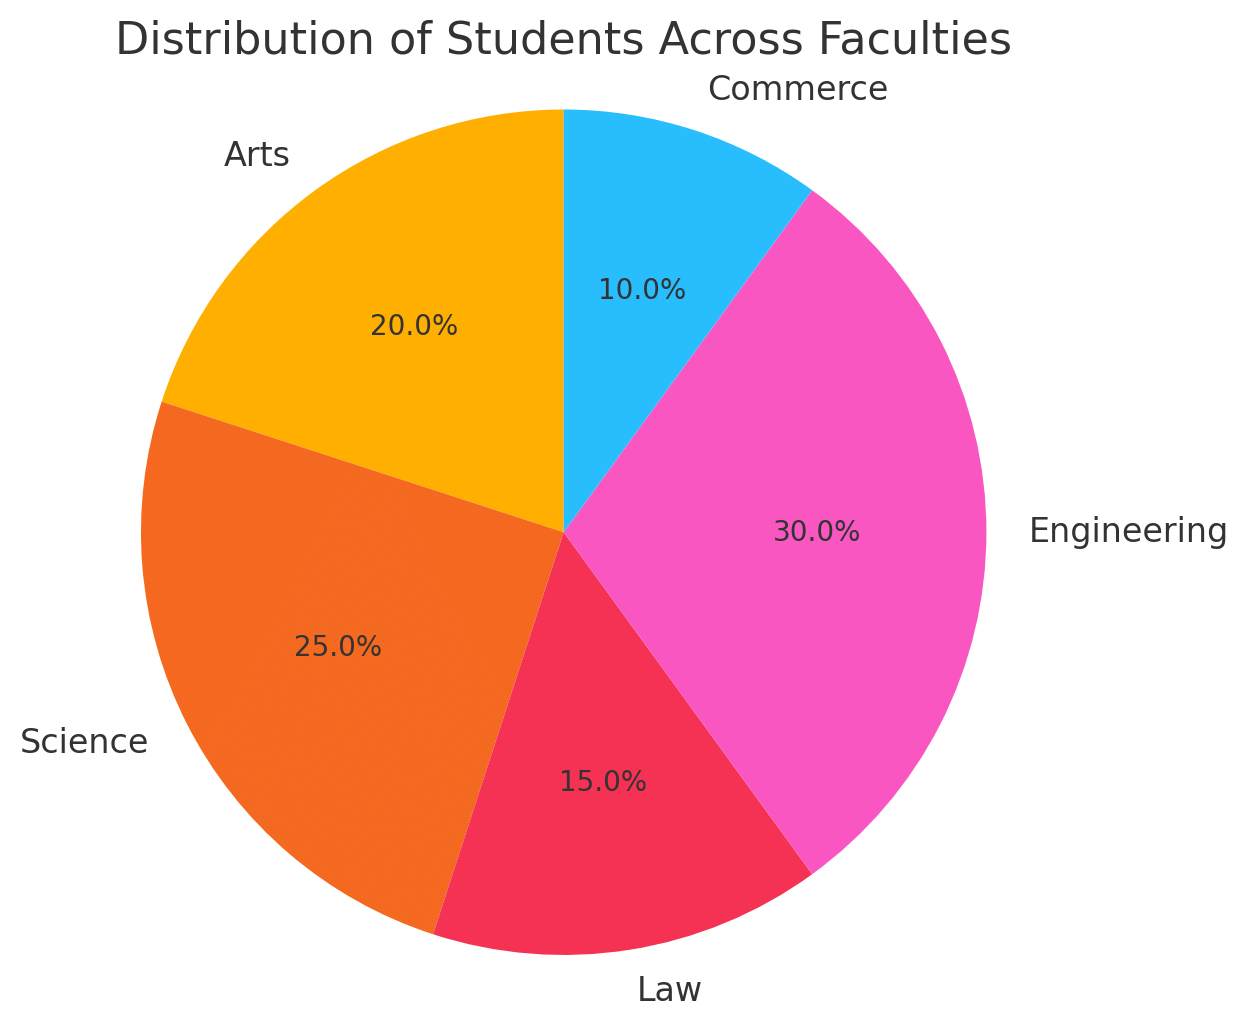
In a sequence of numbers, each term is generated by multiplying the previous term by 2 and then subtracting 1. If the first term is 3, what is the fourth term in the sequence?
A person invests Rs 5000 at a simple interest rate of 8 % per annum for 3 years. What is the total interest earned by the person at the end of the period?
Rs 1000
Rs 1200
Rs 1400
Rs 1600
A person invests 5000 at a simple interest rate of 8% per annum for 3 years. What is the total interest earned by the person at the end of the period?
A bar graph shows the number of students in 5 departments of a college. If the average number of students is 240 and the number of students in the Science department is 320, how many students are there in total in the other four departments?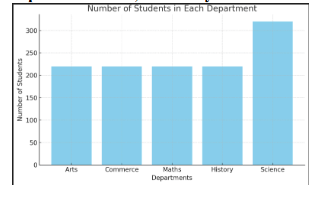
About Data Interpretation - CUET-UG
Data Interpretation is a vital chapter for CUET-UG aspirants. Mastering the concepts covered in this chapter is essential for securing a top rank.
By rigorously practicing the previous year questions associated with this chapter, you can identify high-yield topics, understand the examiner's perspective, and boost your confidence during the actual exam.
Frequently Asked Questions
Why focus on Data Interpretation PYQs?
Analyzing PYQs for this specific chapter reveals the most frequently tested concepts and the typical complexity of questions, allowing you to tailor your study plan efficiently.
How to best use this analysis?
Review the topic breakdown to see which sub-topics within Data Interpretation carry the most weight. Then, tackle the questions iteratively to solidify your understanding.