The term ecology was coined by Ernst Haeckel, in 1866.
Ecologydeals with the study of the dependence and interaction of organisms with their environment. The term ecology is believed to have been coined by Ernst Haeckel although its first authentic use was made by Reiter in 1885. The word originates from the Greek word ‘oikos’, meaning a "place to live."
Brief History:
In the 18th and 19th centuries, ecology progressed considerably.
Carl Linnaeus and his work on nature's economy was the first step toward the study of ecology.
Systematics term for the book Systema Naturae was coined by Linnaeus.
William Bateson later explained the theory of inheritance usinggenetics.
To the Mendelian experiments, William Bateson gave the word genetics.
Concept of the ecosystem was adopted and further developed by Odum.
The word ecology was coined by the German zoologist Ernst Haeckel, who used the term oekologie to mean "the relationship of the animal to both its organic and its inorganic environment."
Also Read: Principles of Inheritance & Variation
02
PYQ 2020
medium
biologyID: kcet-202
In the following equation of Verhulst - Pearl logistic growth, the letter ' ' denotes________
1
Carrying capacity
2
Population density
3
Extrinsic rate of natural increases
4
Intrinsic rate of natural increases
Official Solution
Correct Option:
(4)
Verhulst-Pearl logistic growth is expressed by:
where population density at time the maximum number of organisms that can be supported by a habitat without environmental degradation is called carrying capacity the number of birth rates minus the number of death rates in a population is called the intrinsic rate of natural increase.
03
PYQ 2020
medium
biologyID: kcet-202
In the following equation of Verhulst - Pearl logistic growth, the letter 'r denotes _______
1
Extrinsic rate of natural increase
2
Intrinsic rate of natural increase
3
Carrying capacity
4
Population density
Official Solution
Correct Option:
(2)
Verhulst-Pearl Logistic Growth Equation:
$ N t \frac{dN}{dt} r K \left( \frac{K - N}{K} \right) $: Fraction of carrying capacity available for growth.
The correct answer is (B) Intrinsic rate of natural increase.
04
PYQ 2021
medium
biologyID: kcet-202
Population size keeps changing depending on different factor/s such as
1
Food availability
2
Predation pressure
3
Adverse weather
4
All of the above
Official Solution
Correct Option:
(4)
Population dynamics, a core concept in biology, refers to the study of how populations change over time due to various factors. Let's explore the factors mentioned in the question that affect population size:
Food Availability: The presence of sufficient food resources is a critical determinant of population size. A plentiful supply of food can lead to population growth as organisms have the necessary resources to survive and reproduce. Conversely, scarcity of food can result in population decline due to starvation and decreased fertility.
Predation Pressure: This factor pertains to the impact of predators on a prey population. Increased predation can reduce population size as more individuals are captured and consumed. Conversely, a reduction in predation pressure can lead to an increase in population size.
Adverse Weather: Weather conditions can have significant impacts on population sizes. Extreme weather events such as storms, droughts, or cold spells can decrease population sizes by causing mortality or reducing reproductive success. Favorable weather conditions can aid in population growth.
Given these explanations, the correct answer to the question regarding the factors impacting population dynamics is "All of the above". Each listed factor—food availability, predation pressure, and adverse weather—contributes to changes in population size. Recognizing these factors helps ecologists understand population trends and the balance within ecosystems.
05
PYQ 2025
medium
biologyID: kcet-202
Which one of the following population attributes, contributes to increase in population density?
1
Natality and Emmigration
2
Mortality and Immigration
3
Natality and Immigration
4
Mortality and Emmigration
Official Solution
Correct Option:
(3)
Definition of Population Density: Population density increases when the number of individuals in a given area rises, influenced by birth (natality) and entry (immigration) rates, and decreases with death (mortality) and exit (emigration) rates.
Option Analysis:
(1) Natality and Emmigration: Natality increases population, but emigration (leaving) decreases it, leading to a net neutral or negative effect. This is incorrect.
(2) Mortality and Immigration: Mortality decreases population, while immigration increases it, resulting in a net neutral or negative effect. This is incorrect.
(3) Natality and Immigration: Both natality (births within the population) and immigration (new individuals entering) add to the population, increasing density. This is correct.
(4) Mortality and Emmigration: Both mortality (deaths) and emigration (leaving) reduce population size, decreasing density. This is incorrect.
Mechanism Insight: Population growth occurs when the birth rate (natality) and influx of individuals (immigration) exceed death rate (mortality) and outflow (emigration).
Conclusion: The correct answer is (3) Natality and Immigration, as both contribute to an increase in population density.
06
PYQ 2025
medium
biologyID: kcet-202
If 8 individuals in a laboratory population of 80 fruit flies died during a specified time interval, the death rate in the population during that period is
1
0.1 individual/time interval
2
1 individual/time interval
3
0.01 individual/time interval
4
0.001 individual/time interval
Official Solution
Correct Option:
(1)
Definition of Death Rate: The death rate is the number of individuals dying divided by the total population over a specific time interval.
Calculation:
Total population = 80 fruit flies.
Number of deaths = 8 individuals.
Death rate = Number of deaths / Total population = 8 / 80 = 0.1 individual/time interval.
Option Analysis:
(1) 0.1 individual/time interval: Matches the calculated death rate. This is correct.
(2) 1 individual/time interval: This would imply all 80 died, which is incorrect.
(3) 0.01 individual/time interval: This is too low (1/100 of the population).
(4) 0.001 individual/time interval: This is even lower, not reflecting the data.
Conclusion: The correct answer is (1) 0.1 individual/time interval, as it accurately represents the proportion of deaths.
07
PYQ 2026
medium
biologyID: kcet-202
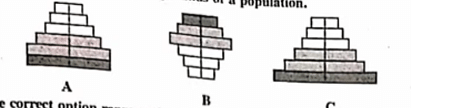
The following graphs represent age pyramids of a population.
1
A - stable, B - expanding, C - declining
2
A - expanding, B - stable, C - declining
3
A - stable, B - declining, C - expanding
4
A - declining, B - stable, C - expanding
Official Solution
Correct Option:
(3)
Step 1: Understanding the Concept: Age pyramids graphically depict the age distribution within a population. The shape of the pyramid indicates whether the population is growing, stable, or shrinking. Step 2: Key Formula or Approach: Analyze the width of the bottom tier (pre-reproductive age group) relative to the middle tier (reproductive age group) for each pyramid. Step 3: Detailed Explanation:
In Pyramid A, the base (pre-reproductive individuals) is roughly equal in width to the tier above it (reproductive individuals). This bell-shaped structure indicates zero growth, meaning the population is stable.
In Pyramid B, the base is distinctly narrower than the middle reproductive section. This urn-shaped structure indicates that fewer offspring are being produced than are needed to replace the current generation, meaning the population is declining.
In Pyramid C, the base is very broad and significantly wider than the reproductive tier. This typical pyramid shape indicates a high birth rate and a rapidly expanding population.
Matching these shapes to their statuses gives: A - stable, B - declining, C - expanding. Step 4: Final Answer: The correct option is (3).
About Population Ecology - KCET
Population Ecology is a vital chapter for KCET aspirants. Mastering the concepts covered in this chapter is essential for securing a top rank.
By rigorously practicing the previous year questions associated with this chapter, you can identify high-yield topics, understand the examiner's perspective, and boost your confidence during the actual exam.
Frequently Asked Questions
Why focus on Population Ecology PYQs?
Analyzing PYQs for this specific chapter reveals the most frequently tested concepts and the typical complexity of questions, allowing you to tailor your study plan efficiently.
How to best use this analysis?
Review the topic breakdown to see which sub-topics within Population Ecology carry the most weight. Then, tackle the questions iteratively to solidify your understanding.