Organisms And Populations
18 previous year questions.
High-Yield Trend
Chapter Questions 18 MCQs
In nature, we rarely find isolated, single individuals of any species; majority of them live in groups in a well-defined geographical area, share or compete for similar resources, potentially interbreed and thus constitute a population. The population has certain attributes whereas, an individual organism does not. A population at a given time is composed of individuals of different ages. The size of the population tells us a lot about its status in the habitat. Whatever ecological processes we wish to investigate in a population, be it the outcome of competition with another species, the impact of the predator or the effect of pesticide application, we always evaluate in terms of any change in the population size. The size, in nature, could be low or go into millions. Population size, technically called population density (N) need not necessarily be measured in numbers only. The size of a population for any species is not a static parameter. It keeps on changing with time depending on various factors including food availability, predation pressure and adverse weather. (a) The Monarch butterfly is highly distasteful to its predator because of a special chemical present in its body. How does the butterfly acquire this chemical?
(b) If population density at a time t + 1 is 800, Emigration = 100, Immigration = 200, Natality = 200 and Mortality = 150, calculate the population density at time t and comment upon the type of age pyramid that will be formed in this case.
Student to attempt either sub-part (c) or (d):
(c) What is the difference in a method of measuring population density in an area if there are 200 carrot grass plants to only single huge banyan tree?
\begin{center} OR \end{center} (d) Name two methods to measure the population density of tigers.
Student to attempt either option (A) or (B):
(A) How is the interaction between Ophrys and its specific bee pollinator one of the best examples of co-evolution? Explain.
OR
(B) Arrange the given important steps of decomposition in their correct order of occurrence in the breakdown of complex organic matter and explain the fourth step in the process.
(b) Out of the two population growth curves, which one is considered a more realistic for most populations? Why?
(c) Draw a growth curve where resources are not limiting for the growth of a population and give its equation.
Student to attempt either option (A) or (B):
(A) Explain how the interaction between a fig tree and its tight one-to-one relationship with the pollinator species of wasp is one of the best examples of mutualism.
OR
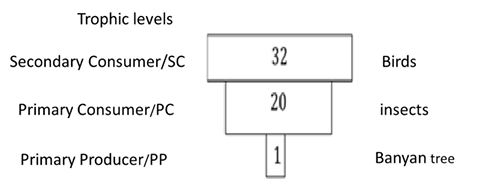
(B) Correctly depict (also indicate the trophic level) and describe the ecological pyramid of number with 32 birds dependent on 20 insects feeding on one banyan tree.
Answer the following questions:
- [(i)] Describe the population growth curve applicable in a population of any species in nature that has unlimited resources at its disposal.
- [(ii)] Explain the equation of this growth curve.
- [(iii)] Name the growth curve and depict a graphical plot for this type of population growth.
- [(i)] Explain the conclusion drawn by Alexander von Humboldt during his extensive explorations in the wilderness of South American jungles.
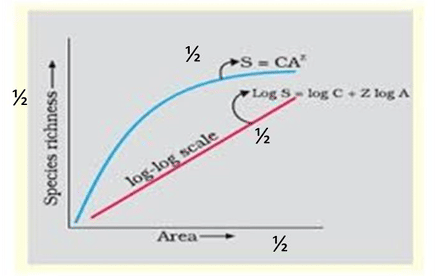
- [(ii)] Give the equation of the Species-Area relationship.
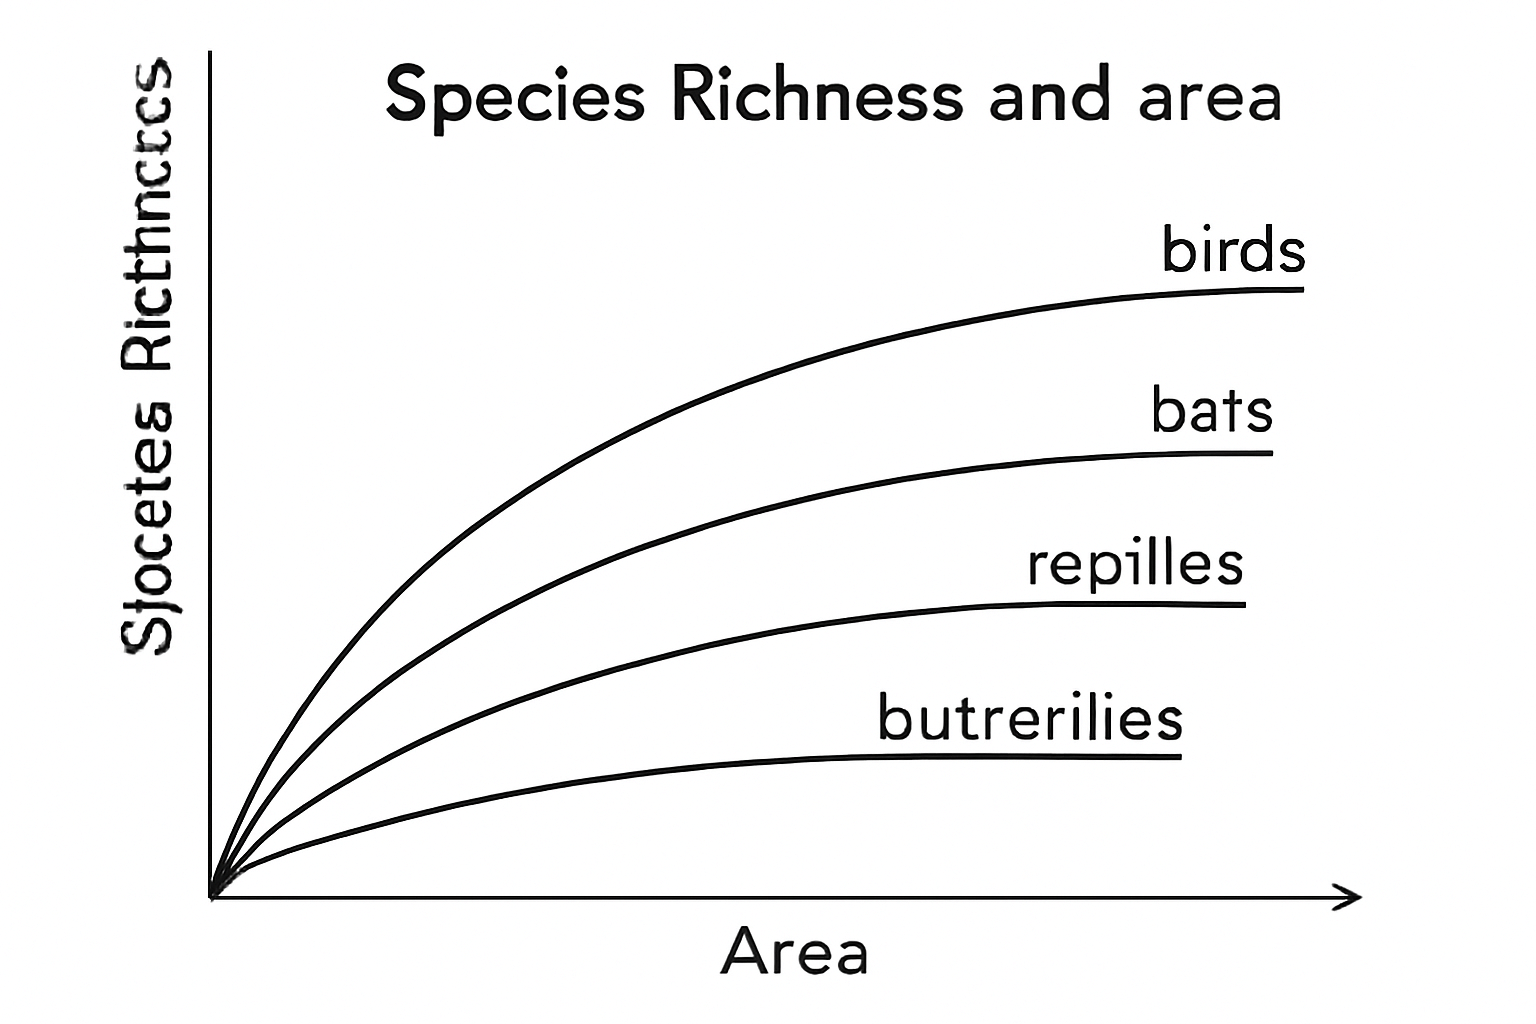
- [(iii)] Draw a graphical representation of the relation between species richness and area for a wide variety of taxa such as birds, bats, etc.
In nature, we rarely find isolated, single individuals of any species; majority of them live in groups in a well-defined geographical area, share or compete for similar resources, potentially interbreed and thus constitute a population. The population has certain attributes whereas, an individual organism does not. A population at a given time is composed of individuals of different ages. The size of the population tells us a lot about its status in the habitat. Whatever ecological processes we wish to investigate in a population, be it the outcome of competition with another species, the impact of the predator or the effect of pesticide application, we always evaluate in terms of any change in the population size. The size, in nature, could be low or go into millions. Population size, technically called population density (N) need not necessarily be measured in numbers only. The size of a population for any species is not a static parameter. It keeps on changing with time depending on various factors including food availability, predation pressure and adverse weather. (a) The Monarch butterfly is highly distasteful to its predator because of a special chemical present in its body. How does the butterfly acquire this chemical?
(b) If population density at a time t + 1 is 800, Emigration = 100, Immigration = 200, Natality = 200 and Mortality = 150, calculate the population density at time t and comment upon the type of age pyramid that will be formed in this case.
Student to attempt either sub-part (c) or (d):
(c) What is the difference in a method of measuring population density in an area if there are 200 carrot grass plants to only single huge banyan tree?
\begin{center} OR \end{center} (d) Name two methods to measure the population density of tigers.
(a) (i) Describe the population growth curve applicable in a population of any species in nature that has unlimited resources at its disposal.
(ii) Explain the equation of this growth curve.
(iii) Name the growth curve and depict a graphical plot for this type of population growth.
OR
(b) (i) Explain the conclusion drawn by Alexander von Humboldt during his extensive explorations in the wilderness of South American jungles.
(ii) Give the equation of the Species-Area relationship.
(iii) Draw a graphical representation of the relation between species richness and area for a wide variety of taxa such as birds, bats, etc.
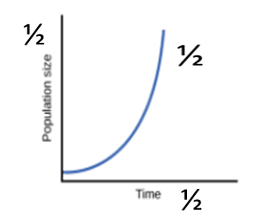
(a) (i) Describe the population growth curve applicable in a population of any species in nature that has limited resources at its disposal.
(ii) Give the equation of this growth curve.
(iii) Name the growth curve and depict a graphical plot for this type of population growth.
OR
(b) (i) Explain the Species-Area relationship within a natural forest and also predict the nature of the graph when species richness is plotted against the area for a wide variety of taxa.
(ii) Depict the graphical relationship between species richness and area.
(iii) Give the equation of the Species-Area relationship for a wide variety of taxa on a logarithmic scale.
About Organisms And Populations - CBSE-CLASS-XII
Organisms And Populations is a vital chapter for CBSE-CLASS-XII aspirants. Mastering the concepts covered in this chapter is essential for securing a top rank.
By rigorously practicing the previous year questions associated with this chapter, you can identify high-yield topics, understand the examiner's perspective, and boost your confidence during the actual exam.
Frequently Asked Questions
Why focus on Organisms And Populations PYQs?
Analyzing PYQs for this specific chapter reveals the most frequently tested concepts and the typical complexity of questions, allowing you to tailor your study plan efficiently.
How to best use this analysis?
Review the topic breakdown to see which sub-topics within Organisms And Populations carry the most weight. Then, tackle the questions iteratively to solidify your understanding.