JEE-MAIN SERIES Chemistry
Radioactive Decay
1 previous year questions.
Volume: 1 Ques
Yield: Medium
High-Yield Trend
1
2025 Chapter Questions 1 MCQs
01
PYQ 2025
medium
chemistry ID: jee-main
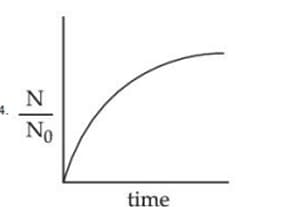
For bacterial growth in a cell culture, growth law is very similar to the law of radioactive decay. Which of the following graphs is most suitable to represent bacterial colony growth? Where - Number of Bacteria at any time, - Initial number of Bacteria.
1
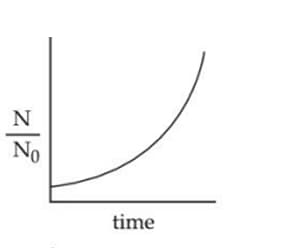
2
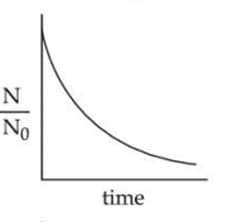
3
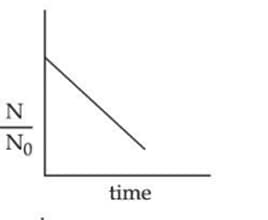
4
About Radioactive Decay - JEE-MAIN
Radioactive Decay is a vital chapter for JEE-MAIN aspirants. Mastering the concepts covered in this chapter is essential for securing a top rank.
By rigorously practicing the previous year questions associated with this chapter, you can identify high-yield topics, understand the examiner's perspective, and boost your confidence during the actual exam.
Frequently Asked Questions
Why focus on Radioactive Decay PYQs?
Analyzing PYQs for this specific chapter reveals the most frequently tested concepts and the typical complexity of questions, allowing you to tailor your study plan efficiently.
How to best use this analysis?
Review the topic breakdown to see which sub-topics within Radioactive Decay carry the most weight. Then, tackle the questions iteratively to solidify your understanding.